Stock markets and economic growth: from Smoot-Hawley to Donald Trump

In a recent article for the Freeman, Steve Horwitz (who has the great misfortune of being my co-author) argued that stock markets tell us very little about trends in economic growth. Stock markets tell us a lot about profits, but profits of firms on the stock market may be higher because of cronyism. Basically, that is Steve’s argument. He applies this argument in order to respond to those who say that a soaring stock market is the proof that Donald Trump is “good” for the economy.

I know Steve’s article was published roughly a month ago, so I am a little late. But I tend to believe it is never too late to talk about economic history. And basically, its worth pointing out that there are economic history examples to show Steve’s point. In fact, its the best example: Smoot-Hawley.

Bernard Beaudreau from Laval University has advanced, for some years, an underconsumptionist view of the Great Depression (I consider it a “dead theory”). While I am highly unconvinced by this theory (in both its original and current “post-keynesian” reformulation), Beaudreau tries hard to resurrect the theory (see here and here) and merits to be discussed. In the process, Beaudreau attempted to reestimated the effects of of Smoot-Hawley on the stock market with an events study. Unconvinced about the rest of his research, this is a clear instance of sorting the wheat from the chaff. In this case, the wheat is his work (see here for his article in Essays in Economic and Business History) on Smoot-Hawley.

Basically, Beaudreau found that good news regarding the probability of the adoption of the tariff bill actually pushed the stock market to appreciate. Thus, Smoot-Hawley -which had so many negative macroeconomic ramifications* – actually boosted the stock market. Firms that gained from the rising tariffs actually saw greater profits for themselves and thus the firms on the stock market would have been excited at the prospect of restricting their competitors. If that is true, could it be that Donald Trump is the modern equivalent (for the stock market) of Smoot-Hawley.

*NDLR: I believe that Allan Meltzer was right in saying that the Smoot-Hawley might have had monetary ramifications that contributed to the money supply collapse. It was a real shock that precipitated the collapse of weak banks which then caused a nominal shock and then the sh*t hit the proverbial fan.

On 19th Century Tariffs & Growth

A few days ago, Pseudoerasmus published a blog piece on Bairoch’s argument that in the 19th century, the countries that had high tariffs also had fast growth.  It is a good piece that summarizes the litterature very well. However, there are some points that Pseudoerasmus eschews that are crucial to assessing the proper role of tariffs on growth. Most of these issues are related to data quality, but one may be the result of poor specification bias. For most of my comments, I will concentrate on Canada. This is because I know Canada best and that it features prominently in the literature for the 19th century as a case where protection did lead to growth. I am unconvinced for many reasons which will be seen below.

Data Quality

Here I will refrain my comments to the Canadian data which I know best. Of all the countries with available income data for the late 19th century, Canada is one of those with the richest data (alongside the UK, US and Australia). This is largely thanks to the work of M.C. Urquhart who recreated the Canadian GNP series fom 1870 to 1926 in collaborative effort with scholars like Marvin McInnis, Frank Lewis, Marion Steele and others.

However, even that data has flaws. For example, me and Michael Hinton have recomputed the GDP deflator to account for the fact that its consumption prices component did not include clothing. Since clothing prices behaved differently than the other prices from 1870 to 1885, this changes the level and trend of Canadian incomes per capita (this paper will be completed this winter, Michael is putting the finishing touch and its his baby).  However, like Morris Altman, our corrections indicate a faster rate of growth for Canada from 1870 to 1913, but in a different manner. For example, there is more growth than believed in the 1870-1879 period (before the introduction of the National Policy which increased protection) and more growth in the 1890-1913 period (the period of the wheat boom and of easing of trade restrictions).

Moreover, the work of Marrilyn Gerriets, Alex Chernoff, Kris Inwood and Jim Irwin (here, here, here, here) that we have a poor image of output in the Atlantic region – the region that would have been adversely affected by protectionism. Basically, the belief is a proper accounting of incomes in the Atlantic provinces would show lower levels and trends that would – at the national aggregated level – alter the pattern of growth.

I also believe that, for Quebec, there are metrological issues in the reporting of agricultural output. The French-Canadians tended to report volume units in manners poorly understood by enumerators but that these units were larger than the Non-French units. However, as time passed, census enumerators caught on and got the measures and corrections right. However, that means that agricultural output from French-Canadians was higher than reported in the earlier census but that it was more accurate in the later censuses. This error will lead to estimating more growth than what actually took place. (I have a paper on this issue that was given a revise and resubmit from Agricultural History). 

Take all of these measurements issue and you have enough doubt in the data underlying the methods that one should feel the need to be careful. In fact, if the sum of these (overall) minor flaws is sufficient to warrant caution, what does it say about Italian, Spanish, Portugese, French, Belgian, Irish or German GDP ( I am not saying they are bad, I am saying that I find Canada’s series to be better in relative terms).

How to measure protection?

The second issue is how to measure protection. Clemens and Williamson offered a measure of import duties revenue over imports volume. That is a shortcut that can be used when it is hard to measure effective protection. But, it may be a dangerous shortcut depending on the structure of protection.

Imagine that I set an import duty so high as to eliminate all entry of the good taxed (like Canada’s 300% import tax on butter today). At that level, there is zero revenue from butter import and zero imports of butter. Thus, the ratio of protection is … zero. But in reality, its a very restrictive regime that is not being measured.

More recent estimates for Canada produced by Ian Keay and Eugene Beaulieu (in separate papers, but Keay’s paper was a conference paper) attempted to measure more accurate indicators of protection and the burden imposed on Canadians. Beaulieu and his co-author found that using a better measure, Canada’s trade policy was 11% more restrictive than believed. Moreover, they found that the welfare loss kept increasing from 1870 to 1890 – reaching a figure equal to roughly 1.5% of GDP (a non-negligible social cost).

It ought to be noted though that alongside Lewis and Harris, Keay has found that the infant industry argument seems to apply to Canada (I am not convinced, notably for the reasons above regarding GDP measurements). However, that was in the case of Canada only and it could have been a simple outlier. Would the argument hold if better trade restriction measures were gathered for all other countries, thus making Canada into a weird exception?

James Buchanan to the rescue

My last argument is about political economy. Was the institutional arrangement of protection a way to curtail government growth? Protection is both a method for helping national industries and for raising revenues. However, the government cannot overprotect at the risk of loosing revenues. It must protect just enough to allow goods to continue entering to earn revenues from imports.  This tension is crucial especially since most 19th century countries did not have uniform general tariffs (like a flat 5% import duty) which would have very wide bases. The duties tended to concern a few goods very heavily relative to other goods. This means very narrow tax bases.

Standard public finance theory mandates wide tax bases with a focus on inelastic sources. However, someone with a public choice perspective (like James Buchanan) will argue that this offers the possibility for the government to grow. Basically, a public choice theorist will argue that the standard public finance viewpoint is that the sheep is tame. Self-interested politicians will exploit this tameness to be elected and this might imply growing government. However, with a narrow and elastic tax base, politicians are heavily constrained. In such a case, governments cannot grow as much.

The protection of the 19th century – identified by many as a source of growth – may thus simply be the symptom of an institutionnal arrangement that was meant to keep governments small. This may have stimulated growth by keeping other sectors of the economy more or less free of government meddling. So, maybe protection was the offspring of the least flawed institutional arrangement that could be adopted given the political economy of the time.

This last argument is the one that I find the most convincing in rebuttal to the Bairoch argument. It means that we are suffering from a poor specification bias: we have identified a symptom of something else as the cause of growth.

My favorite posts at NOL this year

Last week I promised y’all a post on my favorite reads at NOL this year. I almost always keep my promises, so below is a long-ish list of essays I really enjoyed reading and learning from this year.


My absolute favorite essay of 2016 at NOL was Barry Stocker’s analysis of the attempted coup in Turkey. Dr Stocker has spent a quarter of a century in the Turkish-speaking world and all of his acquired wisdom of the region is on display in the piece. Barry didn’t post much here this year, but I am hoping that, given the geopolitical situation in his neck of the woods (Dr Stocker teaches political philosophy at Istanbul Tech), he’ll be able to provide much more insight into the challenges the region will face in 2017.

Jacques, who has become sidetracked ever since Donald Trump became the GOP nominee, had an excellent post titled “A Muslim Woman and the Sea” that everyone should read. I don’t agree with it, but the quality of his writing almost demands that you read through the entire piece. In it is the peaceful nostalgia for both youth and French Algeria, the almost careless way he describes his surroundings, and the slow, deliberate manner in how he attacks his enemies. It is all on display for you, his audience, to devour at your leisure. Dr Delacroix is a world-class storyteller.

Mark Koyama’s piece on Jewish communities in premodern Europe garnered a lot of praise, but I found his post on medieval China to be much more fascinating. In the post, Dr Koyama summed up his recent paper (co-authored with UCLA Anderson’s Melanie Meng Xue) on literary inquisitions during the Qing era (1644-1912). What they did was tally up the number of times the state dragged scholars and artists to court in order to accuse them of delegitimizing the Qing government. This had the unfortunate (but predictable) effect of discouraging discussion and debate about society in the public sphere, which stifled dissent and emboldened autocratic impulses.

Chhay Lin had a number of great posts here, some of which were picked up by major outlets like RealClearWorld and 3 Quarks Daily, and Notes On Liberty is lucky to have such a cool cat blogging here. My favorite post of his was the one he did on his childhood in a Cambodian refugee camp along the Khmer-Thai border. What an inspiring story! I hope there are more to come in 2017. (Chhay Lin, by the way, splits his time at NOL with SteemIt, so be sure to check him out there).

Zak Woodman had lots of good posts in his debut year (including NOL‘s most-read article), but the two I enjoyed most were his thoughts on empathy in cultural discourse and his Hayekian take on safe spaces. Both pieces took a libertarian line on the freedom of speech, but Mr Woodman’s careful articles, which are as much about being true to the original meaning of some of the 20th century’s best thinkers as they are about libertarianism, suggests that he has a bright future ahead of him as one of the movement’s deeper thinkers (he’s an undergraduate at UM-Ann Arbor). I look forward to his thoughts in 2017.

Bruno Gonçalves Rosi burst on to NOL‘s scene this year with a number of posts (in both English and Brazilian Portuguese). His blistering critiques of socialism were fundamental and – to me, at least – reminiscent of the debates between libertarians and statists here in the United States in the 1970s and 1980s. My favorite of Dr Rosi’s 2016 posts, however, was his reflection of the 2016 Rio Paralympics that took place in the late summer (at least it was late summer here in Texas). Bruno brilliantly applied the Games to the famous argument about inequality between 20th century American philosophers Robert Nozick and John Rawls. I hope the piece was but a glimpse of what’s to come from Dr Rosi, who also has a keen interest in history and international relations.

Lode Cossaer is probably busy with his very intriguing dissertation (“the institutional implications of the tension between universal individual rights and group self governance”), but he did manage to find some time to dip his feet into the blogging pool with a few insightful posts. My favorite was his explanation of Donald Trump’s Carrier move, which was blasted from all sides of the political spectrum (including libertarians) for being a prime example of “crony capitalism.” Cossaer, in his own delightfully contrarian manner, pointed out that there is a trade-off between the rule of law and lower taxes. This trade-off might not be pretty, but it exists regardless of how you feel about it. Lode, in my opinion, is one of very few thinkers out there who can walk the tight-rope between Rothbardian libertarianism and plain ole’ classical liberalism, and he does so ruthlessly and efficiently. I hope we can get more contrarianism, and more insight into Cossaer’s dissertation, in 2017.

Vincent has been on a roll this month, and I simply cannot choose any single one of his 2016 posts for recognition. His pêle-mêle comments on the debate between historians and economists over slavery is well-worth reading, especially his insights into how French Canadians are portrayed by economic historians in graduate school, as are his thoughts on the exclusion of Native Americans from data concerning living standards in the past. These posts highlight – better than his more famous posts – the fact that economists, along with political philosophers and anthropologists, are doing way better historical work than are traditional historians. Dr Geloso’s post on fake news as political entrepreneurship did a wonderful job, in my eyes, of highlighting his sheer passion for history and his remarkable ability to turn seemingly boring topics (like “political entrepreneurship”) into hard talking points for today’s relevant policy debates.

Federico is still practicing corporate law in Argentina, so every article he writes at NOL is done so in his free time. For that I am deeply grateful. His early August question, “What sort of meritocracy would a libertarian endorse, if he had to?” was intricately stitched together and exemplifies Federico’s prowess as one of the world’s most novel scholars of Hayekian thought. I also enjoyed, immensely, a careful, probing account of human psychology and our ability to act in this short but rewarding post on homo economicus. I look forward to a 2017 filled with Hayekian insights and critical accounts of social, political, and economic life in Buenos Aires.

Rick spent the year at NOL blogging about whatever the hell he wanted, and we were all rewarded for it. Dr Weber is obviously emerging as important conduit for explaining how “politics” works in democratic societies, and perhaps more importantly how to be a better, happier person within the American system. I hope Rick continues to explore federalism though a public choice lens, but I also suspect, given Dr Weber’s topics of choice this year, that Elinor Ostrom would have been interested in what he has to say as well. 2017 awaits! Here is Rick breaking down Trump’s victory over Clinton. You won’t get a finer explanation for why it happened anywhere else. Oh, and how about a libertarian argument for an FDA?

Michelangelo, who is now a PhD candidate in political science at UC Riverside, won my admiration for his brave post on safe spaces and the election of Donald Trump. While 2017 may be composed of uncertainties, one thing that is known is that Trump will be president of the United States. We need to be wary and vocal (just as we were with Bush II and Obama).  Michelangelo was in top form in his piece “…Why I Don’t Trust the Police,” so much so that it stuck with me throughout the year. It is libertarianism at its finest.

William Rein, a sophomore (“second-year”) at Chico State, has been impressive throughout the year. His thoughts do very well traffic-wise (literally thousands of people read his posts), and it’s all well-deserved, but I thought one of his better pieces was one that was relatively slept on: “Gogol Bordello & Multiculturalism.” Mr Rein points out that Political Correctness is destroying fun, and the election of Donald Trump is merely the latest cultural challenge to PC’s subtle tyranny. William weighed in on the safe spaces concept as well and, together with Zak’s and Michelangelo’s thoughts, a coherent libertarian rationale has formed in response to this cultural phenomenon. If you want to know which clouds young libertarian heads are in, NOL is a great place to be.

Edwin initiated the best debate of the year here at NOL with his post on classical liberalism, cosmopolitanism, and nationalism. Barry replied (in my second-favorite post of his for 2016), and Dr van de Haar responded with a third volley: “Classical Liberalism and the Nation-State.” At the heart of their disagreement was (is?) the concept of sovereignty, and just how much the European Union should have relative to the countries comprising the confederation. Dr Stocker concluded the debate (for 2016, anyway) with a final post once again asserting that Brexit is bad for liberty. For Edwin and Barry, sovereignty and international cooperation are fundamental issues in Europe that are not going away anytime soon. NOL is lucky to have their voices and, like Dr Stocker, I hope Dr van de Haar will be able to provide us with many more fascinating and sometimes contrarian insights in 2017.

Lucas Freire wasn’t able to post much here this year (he is doing postdoc work in South Africa), but his post on economics in the ancient world is well worth reading if you are at all interested in methodology and the social sciences. Dr Freire has continually expressed interest in blogging at NOL, and I am almost certain that 2017 will be his breakout year.

Those are my picks and I’m sticking to ’em (with apologies to Rick). Notewriters are free to publish their own lists, of course, and if readers would like to add their own in the ‘comments’ I’d be honored (you can always email me, too). The post I most enjoyed writing this year, by the way (thanks for asking…), was a snarky one questioning the difference between Saudi Arabia and Islamic State. Thanks for everything.

How Well Has Cuba Managed To Improve Health Outcomes? (part 2)

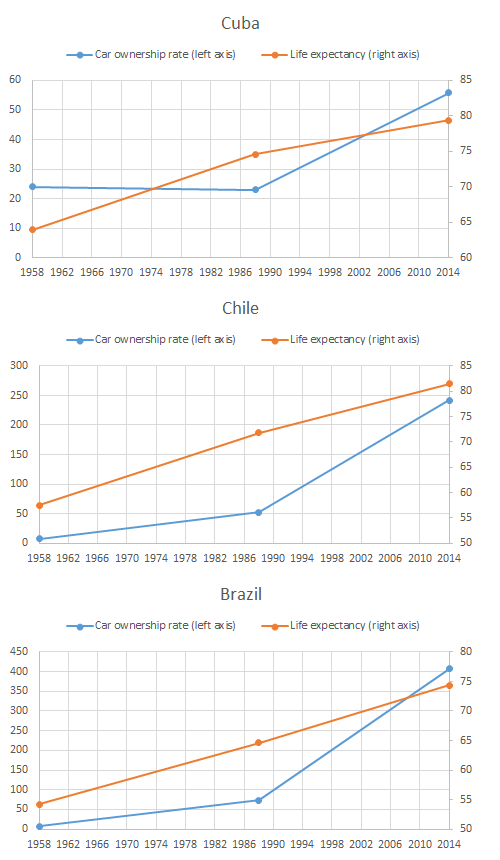
In a recent post, I pointed out that life expectancy in Cuba was high largely as a result of really low rates of car ownerships.  Fewer cars, fewer road accidents, higher life expectancy. As I pointed out using a paper published in Demography, road fatalities reduced life expectancy by somewhere between 0.2 and 0.8 years in Brazil (a country with a car ownership rate of roughly 400 per 1,000 persons). Obviously, road fatalities have very little to do with health care. Praising high life expectancy in Cuba as the outcome Castrist healthcare is incorrect, since the culprit seems to be the fact that Cubans just don’t own cars (only 55 per 1,000). But that was a level argument – i.e. the level is off.

It was not a trend argument. The rapid increase in life expectancy is undeniable, so my argument about level won’t affect the claim that Cubans saw their life expectancy increase under Castro.

I say “wait just a second”.

Cuba is quite unique with regards to car ownership. In 1958, it had the second highest rate of car ownership of all Latin America. However, while the rate went up in all of Latin America between 1958 and 1988, it went down in Cuba. During that period, life expectancy went up in all countries while there were substantial increases in car ownership (which would, all things being equal, slow down life expectancy growth). Take Chile and Brazil as example. In these countries, the rate went up by 6.9% and 8.1% every year – these are fantastic rates of growth. During the same period, life expectancy increased 25% in Chile and 19% in Brazil compared with Cuba where the increase stood at 17%. In Cuba, the moderate decline in car ownership (-0.1% per annum) would have (very) modestly contributed to the increase of life expectancy. In the other countries, car ownership hindered the increase. (The data is also from the WHO section on Road Safety while the life expectancy data is from the World Bank Database)

This does not alter the trend of life expectancy in Cuba dramatically, but it does alter it in a manner that forces us, once more, to substract from Castro’s accomplishments. This increase would not have been the offspring of the master plan of the dictator, but rather an accidental side-effect springing from policies that depressed living standards so much that Cubans drove less and were less subjected to the risk of dying while driving. However, I am unsure as to whether or not Cubans would regard this as an “improvement”.

Below are the comparisons between Cuba, Chile and Brazil.

cars

The other parts of How Well Has Cuba Managed To Improve Health Outcomes?

  1. Life Expectancy Changes, 1960 to 2014
  2. Car ownership trends playing in favor of Cuba, but not a praiseworthy outcome
  3. Of Refugeees and Life Expectancy
  4. Changes in infant mortality
  5. Life expectancy at age 60-64
  6. Effect of recomputations of life expectancy
  7. Changes in net nutrition
  8. The evolution of stature
  9. Qualitative evidence on water access, sanitation, electricity and underground healthcare
  10. Human development as positive liberty (or why HDI is not a basic needs measure)

The struggle for life

Below is an excerpt from my book I Used to Be French: an Immature Autobiography. You can buy it on amazon here.


In elementary school, grades were handed out in class in a terrifying monthly ceremony. The same deranged Principal would walk into each classroom in turn holding a thick pile of “livrets scolaires,” individual grade-booklets, rather than simple, one-shot report cards, under his arm. There was one livret per student per year with numerical scores and verbal comments for each subject matter, and a monthly overall ranking of students. The Principal would lay the grade-books upside down, in reverse order of students’ ranking for the month ending hence, lowest-ranking student first.

For several years, every month, without fail, the lowest-ranking pupil and the first on the mental scaffold was a runty, scrawny, rheumy-eyed boy who always sat in the last row, “Colinet.” The Principal would start ranting as he entered the room; his glasses would drop down his nose and he would deliver himself of the same furious tirade at the top of his voice against miserable, crouching Colinet. He was a large middle-aged man whose eyes became globulous when he was angry. He would foam at the mouth and spittle would dribble down his shirt as he promised Colinet the guillotine or worse. Colinet never got used to it. I sure did not. I almost crapped my pants several times although I was sitting near the front row and the Principal was staring over my head, straight at the back of the room, as he yelled and screamed. As he called out names from Colinet to the higher-ranking pupils, he would calm down, his voice would subside, and his comments became briefer. By the time he reached the livret of the tenth-ranker, his manner had become civilized as if there had been no raging storm minutes earlier.

In my family, there was a completely arbitrary rule that only the first six places were acceptable. I think my parents secretly thought only the first five were really acceptable but added the sixth because it made them feel magnanimous. Once the Principal had called out the ninth-ranked name, my body began to relax and I was breathing normally. If the Principal was down to the fifth livret and my name had not come up, the sweet song of victory began ringing in my heart. “Very good, my boy,” the Principal would say in a low, calm voice as he handed me my livret (to be signed by both parents).

Has Canada been Poorer than the US for so long?

A standard stylized fact in Canada is that we are poorer, on average, than the average American. This has been presented as a fact that is as steady as the northern star. But our evidence on Canadian incomes is pretty shoddy prior to 1870 (here I praise M.C. Urquhart for having designed a GNP series that covers from 1870 to 1926 and links up with the official national accounts even if I think there are some improvements that can be brought to measuring output from some key industries and get the deflator right). But what about anything before 1870? There are some estimates for Ontario from 1826 to 1851 by Lewis and Urquhart (great stuff), but Ontario was pretty much the high-income of Canada.

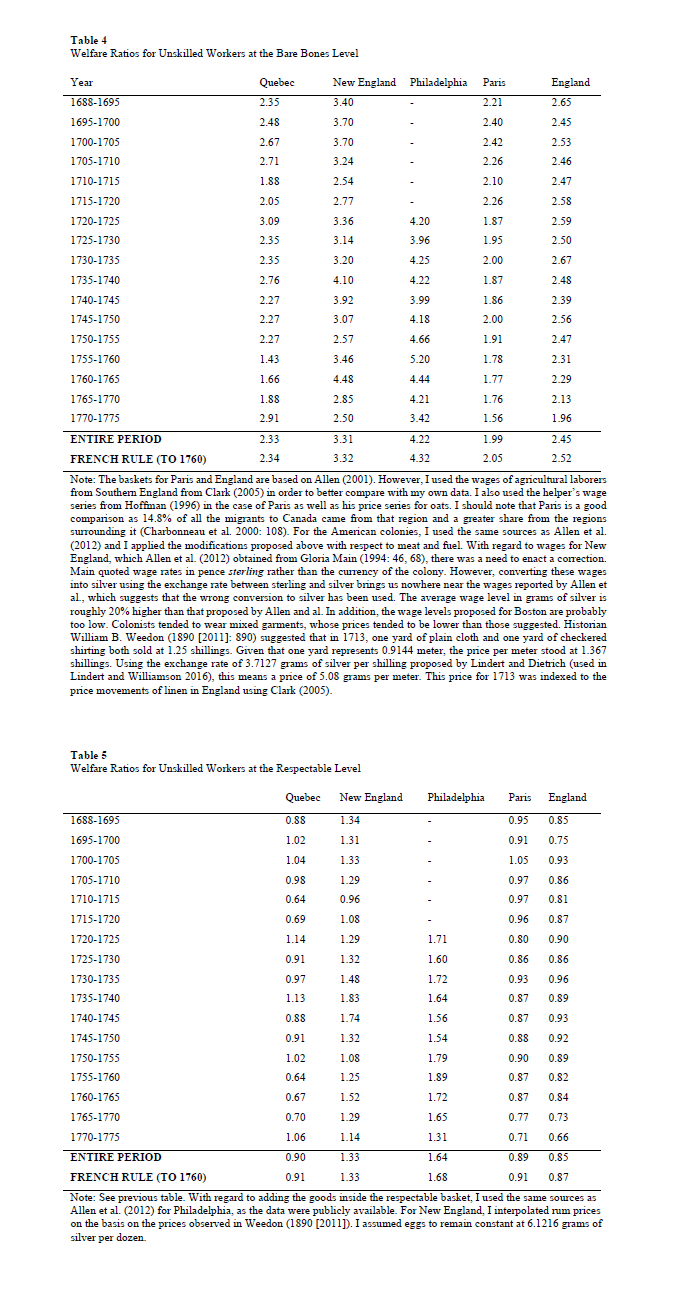
So, can we go further back? This is what my work is about (partially), and I just made available my results on Canadian living standards (proxied by Quebec where the vast majority of the population was) from 1688 to 1775 as captured by welfare ratios. So that’s pretty much the closest we can get to the “founding”. Below are my results derived from this paper. They show that the colonists in Canada were not very much richer than their counterparts in France with the basket meant to capture the meanest of subsistence and roughly equal to their counterparts in France with a basket that includes more manufactured goods like clothing and more alcohol. This explains why most migrants from France to Canada were “volunteered” (in the sense that they were pretty much reluctant migrants) for migration. But the key interesting result is that relative to New England – the poorest of the American colonies – it is poorer regardless of the basket used. Thus, there seems to be truth to the common logic about Canadians being always poorer than the Americans.

comparingcanadane

However, I am not fully convinced of my own results. This may surprise some. The reason is not that I do not trust my data (in fact, I think it is superior to most of what exists for the time given that I will be able to proceed to tons of other data). The reason is simple (and rarely discussed): natives.

Natives are always omitted from the stories of living standards. But they existed nonetheless. In terms of national accounts, if the British and French settlers dispossessed and killed natives, their welfare losses are just not computed. But the welfare losses of a musket shot to the head are real. I have always been convinced that if we could correct estimates of living standards to account for the living standards of natives, the picture would change terribly. The reason is two-fold. The first reason is that the historiography is pretty clear that while they were obviously not nice, the French were nicer than the British towards the Natives (at least until 1763 when the British shifted strategy). In fact, trade between French and Natives was very frequent and so it might be that for the whole population (natives + settlers), the French-area peoples enjoyed more growth and higher average levels. In the British colony, if the settlers killed and dispossessed natives, this is basically the British turning native capital stocks into their own capital stock or into consumption (which would enter settlers GDP but not change total GDP). In essence, this is basically a variation on the arguments of Robert Higgs with regards to measuring the American GDP in World War Two and Albrecht Ritschl on the German interwar growth. I am pretty sure that adjusting for the lives of natives would show a greater level for Canada leading to rough equality between the two colonies. However, I am not sure if the argument would cut that way (my guts say yes) since in their conjectural growth estimates, Mancall and Weiss show that with the natives included, their zero rate of income per capita growth turns into a positive rate.

Nonetheless, I still think that knowing that the settlers were better off in the US as an improvement over the current state of knowledge. Until ways to impute the value of native output and production are found, my current estimates are only a step forward, not the whole nine yards.

Sensitive and Crucial: on Measuring Living Standards in the 18th Century

In the course of the twitterminar on the High-Wage Economy argument (HWE) which generated responses from John Styles on his blog (who has convinced me that the key solution to HWE rests in Normandy, not the Alsace) and many other on Twitter. In the course of that discussion, I skirted a point I have been meaning to make for a long time. However, I decided to avoid it because it is tangentially related to the HWE story. Its about how we measure living standards over space in the past.

Basically, the HWE story is a productivity story and all that matters in such a story is wage rates relative to other input prices. Because we’re talking about relatives, the importance of proper deflators is not that crucial. However, when you move beyond HWE and try to ask the question regarding absolute differences over space in living standards, the wage rates are not sufficient and proper deflators are needed.

They are many key issues to estimating living standards across space. The largest is that given that very few goods crossed borders in the past, converting American incomes into British sterling units using reported exchange rates would be rife with errors and calculating purchasing power parities would be complicated. The solution, very simple and elegant by its simplicity, is to rely on the logic of the poverty measures. Regardless of where you are, there is a poverty threshold. Then, all that is needed is to express incomes as the ratio of income to the poverty line. If the figure is three, then the average income buys three times the poverty line. Expressed as such, comparisons are easy to do. This is what Robert Allen did and it was basically a deeper and more complete approach than Fernand Braudel’s “Grain-Wages” (wage rates divided by grain prices).

Where should the line be?

While this represents a substantial improvement for economic historians like me who are deeply interested in “getting the data right”, there are flaws. In the course of my dissertation on living standards in Canada (see also my working papers here and here), I saw one such flaw in the form of how long the length of the work year was. In fact, a lot of my comments in this post were learned on the basis of Canada as an extreme outlier in terms of sensitivity. In Canada, winter is basically a huge preindustrial limitation on the ability to work year-round (thus, the expression mon pays ce n’est pas un pays, c’est l’hiver). But this flaw is only the tip of the iceberg. First of all, the winter means that the daily energy intake must substantially greater than 2,500 calories in order to maintain body mass. The mechanism through which the temperature increases the energy requirements of the human metabolism is in part the greater weight carried by the heavier clothing in addition to the energy needed by the body to maintain body temperature. At higher altitudes, these are compounded by the difference in air pressure.In their attempt to construct estimates of the living standards of Natives in the Canadian north during the fur trade era, Ann Carlos and Frank  Lewis assert that it is necessary to adjust the basket of comparison to include more calories for the natives given the climate – they assert that 3500 calories were needed rather 2500 calories for English workers.In Russia, Boris Mironov estimated that the average calories ingested stood at 2952 per day between 1865 and 1915 while the adult male had to consume 3204 calories per day. In Canada in the 18th century, it was estimated that patients at the Augustines hospital in Quebec City required somewhere 2628 calories and 3504 calories per day while soldiers consumed on average 2958 calories per day and the average population consumed 2845 calories per day (see my papers linked up above).  The range of calorie requirements for soldiers (which I took from a reference inside my little sister’s military stuff) is quite large: from 3,100 in the desert at 33 degrees Celsius to 4,900 in artic conditions (minus 34 degrees Celsius) – a 58% difference. So basically, when we create welfare ratios for someone in, say, Mexico, the calories needed in the basket should be lower than in the Canadian basket.

Another issue, of greater importance, is the role of fuel. In the welfare ratios commonly used, fuel is alloted at 2MBTU for the basic level of sustenance which. This is woefully insufficient even in moderately warm countries, let alone Canada. My estimates of fuel consumption in Canada is that the worst case hovers around 20MBTU (ten times above the assumption) if the most inefficient form of combustion (important losses) and the worst kind of wood possible (red pine). Similar levels are observed for the American colonies.

Combined together, these corrections suggest that the Canadian poverty threshold should be higher than the one observed in France, England, South Carolina or Argentina. These adjustments can more or less be easily made by using military manuals. The army measures the basic calories requirements for all types of military theaters.

How to factor in family size and use equivalence scales. 

Equivalence scales refer to the role of family size. Given the same income, families of different size will have different levels of welfare. Thanks to economies of scale in housing, cooking, lighting and heating, larger households can get more utility out of one dollar of income. That adjustments are required to render different households comparable is well accepted amongst economists. However, given the sensitivity of any analysis to the assumptions underlying any adjustments, there is an important debate to be had.

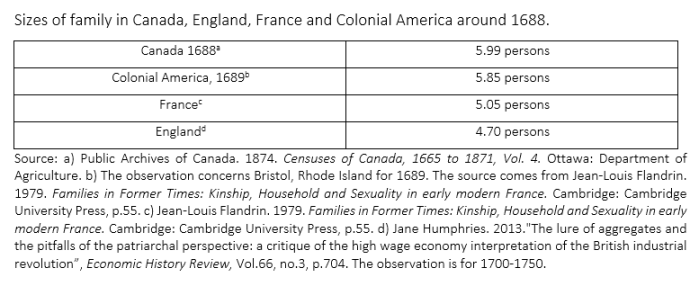
The convention among economic historians has been to assume that households have three adult equivalents. This assumption has gone largely undiscussed. The problem is “which scale to use”. The conversion into adult equivalents is subject to debates. Broadly speaking, three approaches exist. The first uses the square root of the number of individuals. The second attributes the full weight of the first adult, half the weight of the second adult and 30% for each child. This approach is commonly used by the OECD, Statistics Canada and numerous government agencies in Canada The third approach is the one used by the National Academy of Sciences in the United States which proposed to use an exponent ranging between 0.65 and 0.75 to household size but only after having multiplied the number of children by 0.7. As a result, a family of four (two parents, two infants) can have either 2 adult equivalents (square root), 2.1 adult equivalents (OECD and Statistics Canada approach) or 2.36 adult equivalent (NAS approach). The differences relative to the square roots approach are 5% and 18%. If we move to a family of 6 persons, the differences increase to 10.22% and 34.72%.  If we are comparing regions with identical family structures, this would not be a problem. If not, then it is an issue. The selection of one method over another would have important effect on the cost of the living basket, with the NAS approach showing the costliest basket. Using a method relatively close to that of the OECD (although not exactly that measure), Eric Schneider found that the relatively small size of families in England led Allen to underestimate living standards. In a more recent paper, Allen alongside Schneider and Murphy pointed out that extending Schneider’s analysis to Latin America where “family sizes were likely larger (…) than in England and British North America” would amplify the wage gap between the two regions.

familysize

The table above shows how much family size varied around the late 17th century across region. Clearly, this is a non-negligible issue.

Sensitivity of estimates

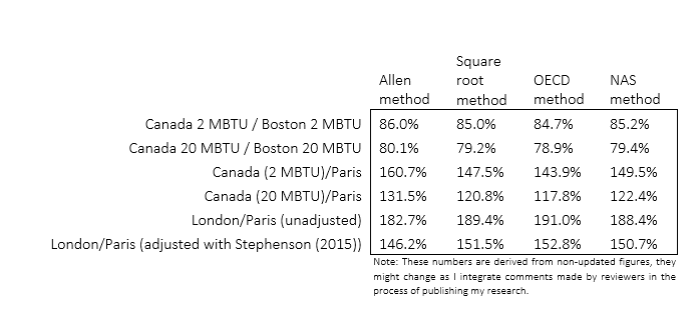
Just to see how much these points matter, let’s modify for two easily modifiable factors: household size (given the numbers above) and fuel requirements (calories from food are harder to adjust for and I am still in the process of doing that). Let’s recompute the welfare ratios (those classified as bare bones) of Canada (the outlier) relative to the other according to different changes circa the end of the 17th century. How much does it matter?

Comparing New World places like Canada and Boston does not change much – they are more or less similar (family size and relative price-wise). However, just adjusting for family size eliminates a quarter of the gap between Canada and Paris (from 61% to somewhere 43.9% and 49.5%). Then, the adjustment for the fact that it is freezing cold in Canada eliminates a little more than half the advantage Canada enjoyed. So roughly two third of the Canadian advantage over Paris (the richest place in France) is eliminated by adjusting for family size and fuel consumption without adjusting for food requirements. However, family size does not affect dramatically the comparison between Paris and London (regardless of whether we use the Allen figures or the Stephenson-Adjusted figures).  Thus, most of the sensitivity issues are related to comparing the New World with the Old World. effectofcorrections

Still, there are some appreciable differences from family structures within Europe (i.e. the Old World) that may alter the relative positions.  For example, Ireland had much larger families than England in the 18th century (see here – the authors shared their dataset with me and a co-author): in 1700, England & Wales had an average household size of 4.7 compared with 5.32 in Ireland. That would moderately disrupt the comparison. Not as much as comparison between the New World and Old World, but enough to make cautious about European differences.

Conclusion

I have seen many discussions regarding the sensitivity of welfare ratios in numerous papers. I am not attempting to make my present point into some form of revolutionary issue. However, all the sensitivity estimates were concentrated on a case or another and they all concern a specific problem. No one has gathered all the problems in one place and provided a “range of estimates”. Maybe its time to go in that direction so that we know which place was poor and which was not (relative to one another, since anything preindustrial was basically dirt-poor by our modern standards).

On Capitalism and Slavery : Pêle-Mêle Comments

Last week, a debate was initiated via an article in the Chronicle of Higher Education that relates to the clash between historians and economists over the topic of slavery. The debate seems acrimonious given the article and at the reading of a special issue of the Journal of Economic History regarding the Half has never been told by Edward Baptist, its hard to conclude otherwise. Pseudoerasmus published comments on the issue in a series of posts and a Trumpian twitterstorm (although the quality is far from being Trumpian). I find myself largely in agreement with him in response to the historians, but there are some pêle-mêle points that I felt I needed to add.

On Historians Versus Economists

To be honest, when I took my first classes in economic history, it seemed clear that there were important points that were agreed upon in the literature on slavery. The first was that the accounting profitability of slavery was not the same as the economic profitability (think opportunity cost here) of slavery. Thus, it was possible that (concentrating on the US here) the peculiar institution could more or less thrive regardless of the social costs it imposed (i.e. slavery is a tax on leisure which also increases the expropriation rate from slaves, and non-slaveowners often had to shoulder the cost of enforcing the institution). This argument is not at all new; in fact it is basically a public choice argument that Gordon Tullock and Anne Krueger could have signed on to without skipping a heartbeat (see Sheilagh Ogilvie – one of my favorite economist who does history in equality with Jane Humphries). The second point of agreement is that no one agreed on how to measure the productivity of slavery in the United States and the distribution of its costs and gains. The second point has been a very deep methodological debate which related to the method of measuring productivity (CES vs Translog TFP – stuff that would make your head blow and which also lead to the self-invitation of the Cambridge Capital Controversy to the debate). The quality of the data has been at the centre-stage as well, and datasets on slave prices, attributes, tasks and many other variables are still being collected (see notably the breathtaking work of Rhode and Olmsted here and here).

Thus, I will admit to being unimpressed by the use of oral histories to contest that literature. In addition, the absence of theory in Baptist’s work yields an underwhelming argument. Oral histories are super-duper important. The work of Jane Humphries on child labor is a case in point of the need to use oral histories. She very carefully used the tales told by children who worked during the industrial revolution to document how labor markets for children worked. The story she told was nuanced, carefully argued and supported by other primary evidence. This is economic history at its best – a merger of cliometrician and historian. In fact, while this is an evaluation that is subjective, the best economists are also historians and vice-versa. The reason for that is the mix of theory with multiple forms of evidence. But they key is to have a theory to guide the analysis.

Unexpectedly for some, the best exposition of this argument comes from Ludwig von Mises in his unknown book Theory and HistoryI was made aware of that book in a discussion with Chris Coyne of George Mason University and I proceeded to reading it. I was surprised how many similarities there were between the Mises who wrote that book and the Douglass Norths and the Robert Fogels of this world. The core argument of Theory and History is that axiomatic statements can be applied to historical events. The goal of historians and economic historians is to sort which theory applies. For example, the theory of signaling and the theory of asymmetric information are both axiomatically true. Without the need for evidence, we know that they must exist. The question of an economic historian becomes to ask “did it matter”? Both theories can compete to offset each other: if signaling is cheap, then asymmetric information can be solved; if it is not, asymmetric information is a problem. Or both may be irrelevant to a given historical development. To explain which two axiomatic statements apply to the event (and in what dosage), you need data (quantitative and qualitative). Thus, Theory and History actually proposes the use of econometrics and statistical methods because it does not try to predict as much as it tries to a) sort which axiomatic statements applied; b) the relative strengths of competing forces; c) the counterfactual scenario.

Without theory, all you have is Baptist’s descriptions which tell us very little and can, incidentally, be distorted by he who recounts the tales he read.

On the Culture of Peasants/Slaves/Slaveowners

When I started my PhD dissertation Canadian economic history, the most annoying thing I saw was the claim that the French-Canadians had “different mentalities” or “more conservative outlooks”. This was basically the way of calling them stupid. This has recently evolved to say that they “maximized goals other than wealth”. Regardless, this was basically: the French-Canadian was not culturally suited for economic development.

But culture is not a fixed variable, it is not an exogenous variable. Culture is basically the coherent framework built by individuals who share certain features to “cut out” the noise. Everyday, we are bombarded with tons of pieces of information and there is no way that the human brain can process them all. Thus, we have a framework – culture (ideology does the same thing) – which tells us what is relevant and what is irrelevant and what interpretation to give to relevant information.

People can cling to old beliefs for a long time, but only if there is no cost to them. I can persist in terrible farming practices if I am not made aware of the proper valuation of the opportunity I am foregoing. For example, British farmers who arrived in Quebec in the 19th century tended to use oxen as they did in England for tilling the soil. They had probably been taught to do that by their parents who learnt it from their grandparents because it was part of the farming culture of England. The behavior was culturally inherited. However, when they saw that the French-Canadians were using horses and that horses – in the Canadian hinterland – got the job done better, they shifted. The culture changed at the sight of how important was the foregone opportunity by continuing to use oxen. Where the British and the French co-existed, both were equally good farmers. Where they could not observe each other, they were all sub-optimal farmers. Seeing the other methods forced changes in culture.

The same applies to slaveowners and slaves! Slaveowners were a more or less tightly knit group that frequented similar circles and were constantly on the lookout to increase productivity. If some master had noticed that he could increase production by whipping more slaves, why would he not adopt this method? Why would he leave 100$ bill on the street? Why did the masters growing cotton in South Carolina not adopt the method of whipping adopted by growers in Louisiana? Without a theory of how culture changes (and what purposes it serves beyond the simplistic Marxist power structure argument), there is no answer to this question. With the work of Rhode and Olmstead, there is an answer: the type of cotton that had higher yields was not suited for growing everywhere! In this case, we are applying my comment from the section above on Historians versus Economists. There are competing theories of explaining increasing output: either some slave masters were unable to observe the other slave masters and adopt the torture methods they had (which would need to be the case for Baptist to be right) or there were biological limitations to growing the better crops in some areas (Rhode and Olmstead).

Two competing theories (they are not mutually exclusive though) that can be tested with data and they set a counterfactual. That is why you need theory to make good history.

One last thing: slave owners were not capitalists

This is probably the most childish thing to come out of works like those of Baptist: to assert that because slaves were capital assets, that the owners were capitalists. That is true if you want to adhere to the inconsistent (and self-contradicting) Marxist approach to capital. In fact, as Phil Magness pointed out to me, slave owners were not free market types. They were very much anti-capitalists. Slavery apologists like Fitzhugh and Carlyle were even more anti-capitalists than that. It’s not because you own capital that you are a capitalist unless you adhere to Marxist theory.

But, capital is just a production input. Its value depends on what it can produce. As Jeffrey Hummel pointed out, there is a deadweight loss from slavery: enforcement costs, the overproduction of cotton because slavery is basically a tax on leisure and the implicit taxation of the output produced by slaves. All three of these factors would have slowed down economic growth in the south. Thus, as capital assets, slaves were relatively inefficient.

Wars and Presidents: Avoiding the Power-Display Bias

This week on EconTalk, Russ Roberts interviewed Bruce Bueno de Mesquita on how presidents who took the United States to war find themselves higher in the rankings of “Great Presidents” (see this paper by Henderson and Gochenour on the issue)  For some time now, I have found myself in agreement with that contention as wars are generally momentous events that stand out in history. In contrast, the man who sits by and does nothing except preventing a war or making it easier for people to trade, that is harder to observe.  But why would evaluating Presidents be associated with such a premium? Individuals are aware that wars are bad, so why are they praising this? On other metrics, how do Presidents fare?

On the power-display bias 

In my forthcoming book on Canadian economic history (published by Palgrave McMillan as part of their Studies in Economic History), I reviewed some pantheons and counter-pantheons of Presidents (which I will present below) and I felt I had to offer my argument regarding these pantheons:

The established pantheon and the counter-pantheon differ mostly due to people’s bias towards positively assessing outward signs of power. When he wrote to one of his correspondents that “absolute power corrupts absolutely,” British historian Lord Acton was not only speaking of politicians, but also of those would retroactively judge them: Acton was referring to a general human tendency – accentuated amongst historians – to be more forgiving of those who hold power, because the powerful are judged by their actions. Indeed, it is easier to size up a politician who undertook significant reforms – regardless of the results obtained thereby – than to evaluate the achievements of one who passively held the line. If the reformer fails, it can be said that at least he tried. Moreover, a given president’s place in the pantheon is closely linked to how many Americans he killed during the military conflicts that defined his reign. The more Americans killed per capita overall, the higher a given president’s ranking in the list of “greats.”

Economic history teaches us, however, that the most proactive presidents may not be the most beneficial to their country, on the contrary. For several years now, Franklin Delano Roosevelt (1933-1945) has been the subject of increased criticism in the economic literature for his interventionist economic policies between 1932 and 1939. Economists Albrecht Ritschl, Monique Ebell, Lee Ohanian and Harold Cole have determined that FDR’s interventionist policies in fact served to prolong the Great Depression.

In other words, the bias we have when evaluating men with power is that we evaluate based on the exercise of displaying the use of power. Those who refrain from using it are, properly, not recorded as historical events are conflicts/tensions/oppositions. This I think is generally a bias that is easily to fall prey to. I am not immune to that even if I happen to have libertarian leanings. I often see in one politician or another in history a man/woman that I wish would be here today to “save the day” (one of my childish belief). But each time I dig around that person, I am less enthused. For example, I used to be an admirer of William Pitt the Younger – a fierce one. After all, he had assisted Wilberforce in ending the slave trade, he had instituted a sinking fund to repay the British public debt (he had willfully tied his hands) and he he had been moderately sympathetic to the American revolution. I saw his role in the wars against France as a contest of circumstances. But, that was the point, I was ready to discount the war. In addition, as I read the work of Jane Humphries on child labor in industrializing Britain (here and here), I discovered more unsettling things.  During the French Wars, the build-up of the British state did lead to some crowding-out on factors markets, notably the labor market. Upon complaints of manufacturers, Pitt proposed to “Yoke Up the Children”. More precisely, he proposed the use of orphan in the public care to work as pauper apprentices to firms at pences on the shilling (bad pun of pennies on the dollar). He “lent” orphans to private firms and its hard to assume that they consented to work (as Humphries’s use of oral histories makes clear). If a person with libertarian leanings like me was willing to excuse such a man before, it is quite telling of how limited knowledge shores up the reputations of powerful men. This is because their use of power overshadows all the rest. Their use of power is like the joke about economists looking where the lamppost is: we evaluate them on what their use of power has illuminated.

Other Metrics

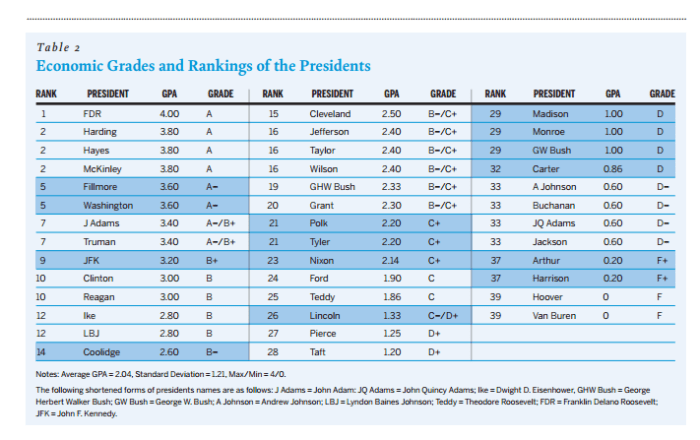
So, are there any other metrics that are less subjected to our inherent power-display bias? Obviously, anything that has a subjective element will be biased. However, evaluating the evolution of living standards under their rule is one way to go at it. Mark Zachary Taylor, in an article published in PS: Political Science and Politicsproposed an economic ranking of US Presidents since 1789. Whichever way you cut it, there is a weak rank correlation between the rankings of presidential greatness and the ranking of economic grades.

Ranking.png

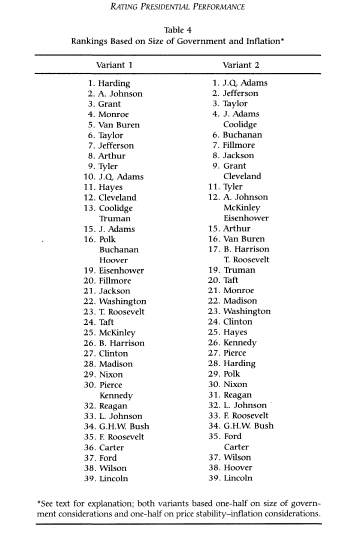
There is another type of ranking, which is more subtle. It measures how much Presidents refrained from expanding federal power. This exercise was made by Richard Vedder and Lowell Gallaway (two great economic historians) who measured presidents based on their changes to the size of government and inflation. This measure alone (see table below) is not sufficient to be convincing, but taken as part of a constellation of rankings, it provides a key piece of evidence. This is really a counter-pantheon to the rankings of presidential greatness. In fact, one could see it as the cost for societies of presidential greatness.

presidentialgreatness

When comes the time to evaluate great rulers, being aware of our biases is crucial (as Lord Acton, I think they should rarely be excused based on flimsy excused like circumstances – the virtue of being an historian/economic historian is that we have enough hindsight to say how terrible certain choices were).  And that awareness should lead us to develop a “dashboard” of rankings to properly weigh the impact of such rulers.

Communism and reading

Below is an excerpt from my book I Used to Be French: an Immature Autobiography. You can buy it on amazon here.


My parents pro-Americanism must have been displayed often because faith in Communism was on the ascendancy during the miserable post-war years. That was when a significant fraction of French public opinion became mindlessly and reflexively anti-American, seemingly forever. Yet, rampant anti-Americanism hardly interfered with American cultural influence. The first movie I saw was a Charlie Chaplin, the first cartoon, Snow White. Every week, when I had been good, I had my copy of Mickey Mouse Magazine (“Mikay Mooze”), although there were excellent French and Belgian children’s periodicals. One of the best French-language children’s periodical had a Far-West serial, “Lucky Luke” that still amazes me for its historical and geographic accuracy. Somebody in the France of the fifties was an attentive student of Americana. Made-in-America action hero comics were forbidden fruits though. To this day, I don’t know why they were prohibited. Perhaps my mother thought them “vulgaires,” like many other things. Later, the first music I paid attention to was jazz.

Movies played a big role in shaping my world-view. I did not develop a sense for what was an American movie rather than a French movie until I was about fifteen. My real second language was thus the extremely bad, stilted French dubbing of American motion pictures. The dubbing is awful to this day. When the hero shoots the bad guy in the gut with a “Take this, you motherfucker!” it comes out in French like this: “This will teach you a lesson, mean man.” All dubbing is done in France by people who don’t know English well, I suspect. The same dozen voices are used over and over again. The dubbers are immortal, it seems. You might say that I was brought up in good part by a curiously distorted Hollywood.

Regional jealousies and transboundary rivers in South Asia

In the final reckoning, Pakistan got about 80 per cent of the Indus and India 20 per cent. India has limited rights on the western rivers and cannot undertake projects on those rivers without providing all the details to Pakistan and dealing with Pakistan’s objections. Why did India put itself in that position? The answer is that if Pakistan got the near-exclusive allocation of the three western rivers, India for its part got the eastern rivers. This was important from the point of view of the Indian negotiators because the water needs of Punjab and Rajasthan weighed heavily with them in seeking an adequate allocation of Indus water for India. Yet, Punjab had a serious grievance over the signing of the IWT [Indus Waters Treaty] by the union government. Citing provisions of the IWT which caused transfer of three river waters to Pakistan, Punjab had terminated all its water-sharing agreements with its neighbouring states in 2004.

The demand of Kutch (in Indian Gujarat), which used to fall into a catchment area of River Indus, decades back, was not taken into consideration despite many petitions, arguing about their historical claim on its water, sent by the prominent Kutchi leaders, in 1950s, to India’s Ministry of Irrigation and Power. Also people from the Indian side of Kashmir always show their ire against the IWT. On 3 April 2002, the Jammu & Kashmir Legislative Assembly, cutting across party affiliations, called for a review of the treaty. The state government has been contending that in spite of untapped hydroelectric potential, the state has been suffering from acute power deficiency due to restrictions put on the use of its rivers by the Indus Treaty. They claim that their interests were not taken into consideration and their views were not taken while signing the treaty. (6-7)

This is from my latest paper, “Disputed Waters: India, Pakistan and the Transboundary Rivers,” published by Studies in Indian Politics, and which you can find here.

Here is a map of all the Indian states mentioned in the excerpt above:

blog-india


Testing the High-Wage Economy (HWE) Hypothesis

Over the last week or so, I have been heavily involved in a twitterminar (yes, I am coining that portemanteau term to designate academic discussions on twitter – proof that some good can come out of social media) between myself, Judy Stephenson , Ben Schneider , Benjamin Guilbert, Mark Koyama, Pseudoerasmus,  Anton Howes (whose main flaw is that he is from King’s College London while I am from the LSE – nothing rational here), Alan Fernihough and  Lyman Stone. The topic? How suitable is the “high-wage economy” (HWE) explanation of the British industrial revolution (BIR).

Twitter debates are hard to follow and there is a need for summaries given the format of twitter. As a result, I am attempting such a summary here which is laced with my own comments regarding my skepticism and possible resolution venues.

An honest account of HWE

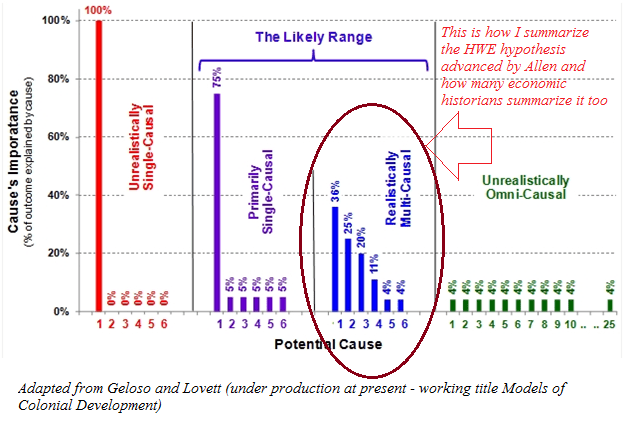
First of all, it is necessary to offer a proper enunciation of HWE’s role in explaining the industrial revolution as advanced by its main proponent, Robert Allen.  This is a necessary step because there is a literature attempting to use high-wages as an efficiency wage argument. A good example is Morris Altman’s Economic Growth and the High-Wage Economy  (see here too) Altman summarizes his “key message” as the idea that “improving the material well-being of workers, even prior to immediate increases in productivity can be expected to have positive effects on productivity through its impact on economic efficiency and technological change”. He also made the same argument with my native home province of Quebec relative to Ontario during the late 19th century. This is basically a multiple equilibria story. And its not exactly what Allen advances. Allen’s argument is that wages were high in England relative to energy. This factors price ratio stimulated the development of technologies and industries that spearheaded the BIR. This is basically a context-specific argument and not a “conventional” efficiency wage approach as that of Allen. There are similarities, but they are also considerable differences. Secondly, the HWE hypothesis is basically a meta-argument about the Industrial Revolution. It would be unfair to caricature it as an “overarching” explanation. Rather, the version of HWE advanced by Robert Allen (see his book here) is one where there are many factors at play but there is one – HWE – which had the strongest effects. Moreover, while it does not explain all, it was dependent on other factors that contributed independently.  The most common view is that this is mixed with Joel Mokyr’s supply of inventions story (which is what Nick Crafts has done). In the graph below, the “realistically multi-causal” explanation is how I see HWE. In Allen’s explanation, it holds the place that cause #1 does. According to other economists, HWE holds spot #2 or spot #3 and Mokyr’s explanations holds spot #1.
hwe

In pure theoretical terms (as an axiomatic statement), the Allen model is defensible. It is a logically consistent construct. It has some questionnable assumptions, but it has no self-contradictions. Basically, any criticism of HWE must question the validity of the theory based on empirical evidence (see my argument with Graham Brownlow here) regarding the necessary conditions. This is the hallmark of Allen’s work: logical consistency. His work cannot be simply brushed aside – it is well argued and there is supportive evidence. The logical construction of his argument requires a deep discussion and any criticism that will convince must encompass many factors.

Why not France? Or How to Test HWE

As a doubter of Allen’s theory (I am willing to be convinced, hence my categorization as doubter), the best way to phrase my criticism is to ask the mirror of his question. Rather than asking “Why was the Industrial Revolution British”, I ask “Why Wasn’t it French”. This is what Allen does in his work when he asks explicitly “Why not France?” (p.203 of his book). The answer proposed is that English wages were high enough to justify the adoption of labor-saving technologies. In France, they were not. This led to differing rates of technological adoptions, an example of which is the spinning jenny.

This argument hinges on some key conditions :

  1. Wages were higher in England than in France
  2. Unit labor costs were higher in England than in France (productivity-adjusted wages) (a point made by Kelly, Mokyr and Ó Gráda)
  3. Market size factors are not sufficiently important to overshadow the effects of lower wages in France (R&D costs over market size mean a low fixed cost relative to potential market size)
  4. The work year is equal in France as in England
  5. The cost of energy in France relative to labor is higher than in England
  6. Output remained constant while hours fell – a contention at odds with the Industrious Revolution which the same as saying that marginal productivity moves inversely with working hours

If most of these empirical statements hold, then the argument of Allen holds. I am pretty convinced by the evidence advanced by Allen (and E.A. Wrigley also) regarding the low relative of energy in England. Thus, I am pretty convinced that condition #5 holds. Moreover, given the increases in transport productivity within England (here and here), the limited barriers to internal trade (here), I would not be surprised that it was relatively easy to supply energy on the British market prior to 1800 (at least relative to France).

Condition #3 is harder to assess in terms of important. Market size, in a Smithian world, is not only about population (see scale effects literature). Market size is a function of transaction costs between individuals, a large share of which are determined by institutional arrangements. France has a much larger population than England so there could have been scale effects, but France also had more barriers to internal trade that could have limited market size. I will return to this below.

Condition #1,2,4 are basically empirical statements. They are also the main points of tactical assault on Allen’s theory.  I think condition #1 is the easiest to tackle. I am currently writing a piece derived from my dissertation showing that – at least with regards to Strasbourg – wages in France presented in Allen (his 2001 article) are heavily underestimated (by somewhere between 12% and 40% using winter workers in agriculture and as much as 70% using the average for laborers in agriculture). The work of Judy Stephenson, Jane Humphries and Jacob Weisdorf has also thrown the level and trend of British wages into doubts. Bringing French wages upwards and British wages downwards could damage the Allen story. However, this would not be a sufficient theory. Industrialization was generally concentrated geographically. If labor markets in one country are not sufficiently integrated and the industrializing area (lets say the “textile” area of Lancashire or the French Manchester of Mulhouse or the Caën region in Normandy) has uniquely different wages, then Allen’s theory can hold since what matters is the local wage rate relative to energy. Pseudoerasmus has made this point but I can’t find any mention of that very plausible defense in Allen’s work.

Condition #2 is the weakest point and given Robert Fogel’s work on net nutrition in France and England, I have no problem in assuming that French workers were less productive. However, the best evidence would be to extract piece rates in textile-producing regions of France and England. This would eliminate any issue with wages and measuring national productivity differences. Piece rates would perfectly capture productivity and thus the argument could be measured in a very straightforward manner.

Condition #4 is harder to assess and more research would be needed. However, it is the most crucial piece of evidence required to settle the issue once and for all. Pre-industrial labor markets are not exactly like those of modern days. Search costs were high which works in a manner described (with reservations) by Alan Manning in his work on monopsony but with much more frictions. In such a market, workers may be willing to trade in lower wage rates for longer work years. In fact, its like a job security argument. Would you prefer 313 days of work guaranteed at 1 shilling per day or a 10% chance of working 313 days for 1.5 shillings a day (I’ve skewed the hypothetical numbers to make my point)? Now, if there are differences in the structure of labor markets in France and England during the 18th and 19th centuries, there might be differences in the extent of that trade-off in both countries. Different average discount on wages would affect production methods. If French workers were prone to sacrifice more on wages for steady employment, it may render one production method more profitable than in England. Assessing the extent of the discount of annual to daily wages on both markets would identify this issue.

The remaining condition (condition #6) is, in my opinion, dead on arrival. Allen’s model, in the case of the spinning jenny, assumed that labor hours moved in an opposite direction as marginal productivity. This is in direct opposition to the well-established industrious revolution. This point has been made convincingly by Gragnolati, Moschella and Pugliese in the Journal of Economic History. 

In terms of research strategy, getting piece rates, proper wage estimates and proper labor supplied estimates for England and France would resolve most of the issue. Condition #3 could then be assessed as a plausibility residual.  Once we know about working hours, actual productivity and real wages differences, we can test how big the difference in market size has to be to deter adoption in France. If the difference seems implausible (given the empirical limitations of measuring effective market size in the 18th century in both markets), then we can assess the presence of this condition.

My counter-argument : social networks and diffusion

For the sake of argument, let’s imagine that all of the evidence favors the skeptics, then what? It is all well and good to tear down the edifice but we are left with a gaping hole and everything starts again. It would be great to propose a new edifice as the old one is being questioned. This is where I am very much enclined towards the rarely discussed work of Leonard Dudley (Mothers of Innovation). Simply put, Dudley’s argument is that social networks allowed the diffusion of technologies within England that fostered economic growth. He has an analogy from physics which gets the point across nicely. Matter has three states : solid, gas, liquid. Solids are stable but resist to change. Gas, matter are much more random and change frequently by interacting with other gas, but any relation is ephemeral. Liquids permit change through interaction, but they are stable enough to allow interactions to persist for some time. Technological innovation is like a liquid. It can “mix” things together in a somewhat stable form.

This is where one of my argument takes life. In a small article for Economic Affairs, I argued (expanding on Dudley) that social networks allowed this mixing (I am also expanding that argument in a working paper with Adam Martin of Texas Tech University). However, I added a twist to that argument which I imported from the work of Israel Kirzner (one of the most cited books in economics, but not by cliometricians – more than 7000 citations on google scholar). Economic growth, in Kirzner’s mind,  is the result of entrepreneurs discovering errors and arbitrage possibilities. In a way, growth is a process of discovering correcting errors. An analogy to make this point is that entrepreneurs look for profits where the light is while also trying to move the light to see where it is dark. What Kirzner dubs as “alertness” is in fact nothing else than repeated and frequent interactions. The more your interact with others, the easier it becomes for ideas to have sex. Thus, what matters is how easy it is for social networks to appear and generate cheap information and interactions for members without the problem of free riders. This is where the work of Anton Howes becomes very valuable. Howes, in his PhD thesis supervised by Adam Martin who is my co-author on the aforementioned project (summary here), showed that most innovators went in frequent with one another and they inspired themselves from each other. This is alertness ignited!

If properly harnessed, the combination of the works of Howes and Dudley (and also James Dowey who was a PhD student at the LSE with me and whose work is *Trump voice* Amazing) can stand as a substitute to Allen’s HWE if invalidated.

Conclusion

If I came across as bashing on Allen in this post, then you have misread me. I admire Allen for the clarity of his reasoning and his expositions (given that I am working on a funded project to recalculate tax-based measures in the US used by Piketty to account for tax avoidance, I can appreciate the clarity in which Allen expresses himself). I also admire him for wanting to “Go big or go home” (which you can see in all his other work, especially on enclosures). My point is that I am willing to be convinced of HWE, but I find that the evidence leans towards rejecting it. But that is very limited and flawed evidence and asserting this clearly is hard (as some of the flaws can go his way). Nitpicking Allen’s HWE is a necessary step for clearly determining the cause of BIR. It is not sufficient as a logically consistent substitute must be presented to the research community. In any case, there is my long summary of the twitteminar (officially trademarked now!)

P.S. Inspired by Peter Bent’s INET research webinar on institutional responses to financial crises, I am trying to organize a similar (low-cost) venue for presenting research papers on HWE assessment. More news on this later.
How I Helped Win World War Two

Below is an excerpt from my book I Used to Be French: an Immature Autobiography. You can buy it on amazon here.


All of a sudden, that road was flooded by a long column of trucks overflowing with big, loud, laughing men in distinctive uniforms. People were shouting greetings and waving flags. It seems that an American soldier jumped off his vehicle, swept me up into his arms and kissed me on both cheeks. That may have been because my mother, who had wanted her second child to be a daughter, processed my long blond hair into Goldilock-style ringlets. That I am straight today is a testimony to the resiliency of genetic programming. My mother always insisted the kissing soldier was black. On the one hand, she may have made up this detail for colorful effect. On the other hand, there were so many trucks the soldiers may have belonged to a transport unit and hence, probably to a black unit in the segregated Army of the day.

It was August 1944. I was two and my family lived in a (nice) city project right on the periphery of Paris, near one of its main access roads. One thing that bothers me about this visual and auditory recollection is that we lived on the east side of Paris. American soldiers should have been arriving from Normandy, in the west. Yet, the memory is clear.

Before the American forces reached Paris, my mother had sewn a makeshift tricolor French flag. The blue came from my father’s old military service flannel sash (a forgotten and now incomprehensible item of clothing). The red came from a Nazi flag my father had stolen from a German general’s car he was supposed to guard. (The Germans were packing up at the time and very nervous. He might have been shot on the spot if he had been caught.) At a loss for white, my mother made the center piece out of one of my diapers. That’s why I have always felt I played a part, although a small one, in the liberation of Paris, a symbolically important phase of WWII.

I was born and conceived during the Nazi Occupation of France when life was tough and entertainment scarce. My father was a Paris cop. His life was not so tough, however, that he did not have the energy to make my mother pregnant one more time before the Liberation, this time with twins. There was little to eat and milk was rationed so, my mother breastfed me for the longest time. I was precocious. At one point, I think I was able to ask for the breast in grammatically perfect French. It must have been embarrassing for her. Or perhaps I made this up on the basis of bits and pieces I picked up while I was growing up, like some of the other early recollections in these truncated memoirs. They stop at age 21 when I moved to the US for good. I made that choice because I think the second part of my life would be less  interesting to an American readership than the first, the preparatory phase, so to speak.

I  described above my first, full, cinematographic memory. From the days before the Liberation, I remember bit and pieces, like still photographs with some sound, glimpses of German uniforms and the vast, beautiful fire of the Paris general mills, a mile away, set by the US Army Air Corps. It’s a little known fact that the Allies bombed the hell out of France right before and during the Normandy landing. The French never complained much; they were different then, and too sick of the German presence to bitch about collateral damage. When the air raid siren sounded, my mother would wrap me up in a blanket and take me down to the basement of our seven-story apartment house. Some tenants were so jaded by then that they did not bother to take shelter. The basement was a crowded but not especially tragic place.

In spite of this dramatic, first, fully formed memory, nothing really important ever happened to me. I have escaped the Chinese curse, of “living in interesting times,” although I did live in fact in quite interesting times. I waltzed through the murderous second half of the twentieth century with hardly a scratch to show for it. All my life, I have been mostly fortunate. The undeserved lucky breaks more than made up for the few unjustified blows fate has dealt me. The luckiest break was my first coming to the US at eighteen, a prelude to immigration three years later. In this country, no one ever oppressed me successfully though a few tried.  Many gave me a push at just the right moment. Mine is a happy story. This makes it worth telling to the largely glum denizens of the twenty-first century.

I live in the sunny, warm climate I longed for as a child, near the sea I always loved, in a small town rich with the small pleasures I have always appreciated: a variety of movies, a good café in an interesting, animated downtown, several bookstores within easy reach, and young people everywhere. My wife is a talented painter whose work I enjoy so much I don’t ever like her to sell it. She has few obligations, and she has not had many for  quite a while. That’s what keeps her beautiful, I think. She is also an immigrant, from the other side of the world from me, yet we see eye-to-eye on most matters. Nevertheless, we each have our own house, feet apart, each gracious in its own way. Although, it’s in the center of town, our tiny plot contains an apple tree, a plum tree, two lemon trees, and a big fig tree. All bear fruits, especially the fig tree, a sort of miracle I never fully grasp, for reasons that will become clear below.

I am a retired university professor and scholar, fairly proud of my scholarship, happy to have been a professor and equally happy to not be one anymore. Most mornings, weather permitting (it permits often, here in California), after the gym and after coffee at Lulu’s, I am forced to decide whether I want to go sailing, or fishing, or just putter about my boat, or start one of my sometimes fairly good postcard paintings, or again, write a micro-story. Sometimes, I just simply spend the whole day reading, for no particular reason and to no particular purpose. I read much history but also almost anything anyone hands me. That would include a fair amount of trash. You guessed it: I am a satisfied lazy man.

The pages below tell the tale of the unlikely beginnings of the journey that brought me to my current state of beatific smugness.

On Cuba’s Fake Stats

On Monday, my piece on the use violence for public health purposes in Cuba (reducing infectious diseases through coercion at the expense of economic growth which in turn increases deaths from preventable diseases related to living standards) assumed that the statistics were correct.

They are not! How much so? A lot! 

As I mentioned on Monday, Cuban doctors face penalties for not meeting their “infant mortality” targets. As a result, they use extreme measures ranging from abortion against the mother’s will to sterilization and isolation.  They also have an incentive to lie…(pretty obvious right?)

How can they lie? By re-categorizing early neonatal (from birth to 7th day) or neonatal deaths (up to 28th day) as late fetal deaths. Early neonatal deaths and late fetal deaths are basically grouped together at “perinatal” deaths since they share the same factors. Normally, health statistics suggest that late fetal deaths and early neonatal deaths should be heavily correlated (the graph below makes everything clearer).  However late fetal deaths do not enter inside the infant mortality rates while the early neonatal deaths do enter that often-cited rate (see graph below).

Death Structures.png

Normally, the ratio of late fetal deaths to early neonatal deaths should be more or less constant across space. In the PERISTAT data (the one that best divides those deaths), most countries have a ratio of late fetal to early neonatal deaths ranging from 1.04 to 3.03. Cuba has a ratio of more than 6. This is pretty much a clear of data manipulation.

In a recent article published in Cuban Studies, Roberto Gonzales makes adjustments to create a range where the ratio would be in line with that of other countries. If it were, the infant mortality of Cuba would be between 7.45 and 11.16 per 1,000 births rather than the 5.79 per 1,000 reported by the regime – as much as 92% higher. As a result, Cuba moves from having an average infant mortality rate in the PERISTAT data to having the worst average infant mortality in that dataset – above that of most European and North American countries.

So not only is my comment from Monday very much valid, the “upside” (for a lack of a better term) I mentioned is largely overblown because doctors and politicians have an incentive to fake the numbers.

Castro: Coercing Cubans into Health

On Black Friday, one of the few remaining tyrants in the world passed away (see the great spread of democracy in the world since 1988). Fidel Castro is a man that I will not mourn nor will I celebrate his passing. What I mourn are the lives he destroyed, the men and women he impoverished, the dreams he crushed and the suffering he inflicted on the innocents. When I state this feeling to others, I am told that he improved life expectancy in Cuba and reduced infant mortality.

To which I reply: why are you proving my point?

The reality that few people understand is that even poor countries can easily reduce mortality with the use of coercive measures available to a centralized dictatorship. There are many diseases (like smallpox) that spread because individuals have a hard time coordinating their actions and cannot prevent free riders (if 90% of people get vaccinated, the 10% remaining gets the protection without having to endure the cost). This type of disease is very easy to fight for a state: force people to get vaccinated.

However, there is a tradeoff to this. The type of institutions that can use violence so cheaply and so efficiently is also the type of institutions that has a hard time creating economic growth and development. Countries with “unfree” institutions are generally poor and grow slowly. Thus, these countries can fight some diseases efficiently (like smallpox and yellow fever), but not other diseases that are related to individual well-being (i.e. poverty diseases). This implies that you get unfree institutions and low rates of epidemics but high levels of poverty and high rates of mortality from tuberculosis, diarrhea, typhoid fever, heart diseases, nephritis.

This argument is basically the argument of Werner Troesken in his great book, The Pox of LibertyHow does it apply to Cuba?

First of all, by 1959, Cuba was already in the top of development indexes for the Americas – a very rich and healthy place by Latin American standards. A large part of the high levels of health indicators were actually the result of coercion. Cuba actually got its very low levels of mortality as a result of the Spanish-American war when the island was occupied by American invaders. They fought yellow fever and other diseases with impressive levels of violence. As Troesken mentions, the rate of mortality fell dramatically in Cuba as a result of this coercion.

Upon taking power in 1959, Castro did exactly the same thing as the Americans. From a public choice perspective, he needed something to shore up support.  His policies were not geared towards wealth creation, but they were geared towards the efficient use of violence. As Linda Whiteford and Laurence Branch point out, personal choices are heavily controlled in Cuba in order to achieve these outcomes. Heavy restrictions exist on what Cubans can eat, drink and do. When pregnancies are deemed risky, doctors have to coerce women to undergo abortion in spite of their wishes. Some women are incarcerated in the Casas de Maternidad in spite of their wishes. On top of this, forced sterilization in some cases are an actually documented policy tool.   These restrictions do reduce mortality, but they feel like a heavy price for the people. On the other hand, the Castrist regime did get something to brag about and it got international support.

However, when you look at the other side of the tradeoff, you see that death rates from “poverty diseases” don’t seem to have dropped (while they did elsewhere in Latin America).  In fact, there are signs that the aggregate infant mortality rates of many other Latin Americans countries collapsed toward the low-levels seen in Cuba when Castro took over in 1959  (here too). Moreover, the crude mortality rate is increasing while infant mortality is decreasing (which is a strong indictment about how much shorter adult lives are in Cuba).

So, yes, Cuba has been very good at reducing mortality from communicable diseases and choice-based outcomes (like how to give birth) that can be reduced by the extreme use of violence. The cost of that use of violence is a low level of development that allows preventable diseases and poverty diseases to remain rampant. Hardly something to celebrate!

Finally, it is also worth pointing two other facts. First of all, economic growth in Cuba has taken place since the 1990s (after decades of stagnation in absolute terms and decline in relative terms). This is the result of the very modest forms of liberalization that were adopted by the Cuban dictatorship as a result of the end of Soviet subsidies. Thus, what little improvements we can see can be largely attributed to those. Secondly, the level of living standards prior to 1990 was largely boosted by the Soviet subsidies but we can doubt how much of it actually went into the hands of the population given that Fidel Castro is worth 900$ million according to Forbes. Thus, yes, Cubans did remain dirt poor during Castro’s reign up to 1990. Thirdly, doctors are penalized for “not meeting quotas” and thus they do lie about the statistics. One thing that is done by the regime is to categorize “infant deaths” as “late fetal deaths” – its basically extending the definition in order to conceal a poorer performance.

Overall, there is nothing to celebrate about Castro’s dictatorship. What some do celebrate is something that was a deliberate political action on the part of Castro to gain support and it came at the cost of personal freedom and higher deaths from preventable diseases and poverty diseases.

H/T : The great (and French-speaking – which is a plus in my eyes because there is so much unexploited content in French) Pseudoerasmus gave me many ideas – see his great discussion here.