Star Trek Did More For the Cultural Advancement of Women Than Government Policies

The fondest memories of my childhood center on the time I spent with my father watching Star Trek. At the time, I simply enjoyed science fiction. However, as an adult I have often revisited Star Trek (on multiple occasions) and I realized that I had incorporated subconsciously many elements of the show into my own political reasoning.

Not to give too much away about my age, my passion with Star Trek started largely with the Voyager installments. As a result, I ended up seeing Kate Mulgrew as Captain Janeway. And that’s what she was: the captain. I never saw the relevance that she was a woman. A few years ago, I saw her speak at the Montreal Comic-Con (yes, I am that kind of Trekkie) and she mentioned how crucial she thought her role to be for the advancement of women. By that time, I had already started to consider Star Trek as one of the most libertarian-friendly shows ever to have existed. While its economics were strange, its emphasis on tolerance, non-intervention and equality of rights make it hard to argue that it is not favorable to broadly-defined liberal mindset. However, I had not realized how much so until I heard Mulgrew speak about her vision of the role. After all, I had somehow forgotten that Mulgrew was a woman and how novel her role was.

One person who understands how important was this point is Shannon Mizzi who wrote a piece for Wilson Quarterly which I ended up reading while I was still a PhD student. Her core point was that in Star Trek, women were simply professionals. They were rarely seen doing other things than their work. While she argues that this meant that Star Trek played an underappreciated role in the history of women’s advancement, I am willing to go a step further. That step is to assert that the cause of the cultural advancement of women has been better served by Star Trek than by governments. (Please note that I am only considering cultural advancement)

The pre-1900 economic and social history of women would be sufficient in itself to make this point of mine. After all, women were given a lesser legal status by governments. This is both a necessary and sufficient element to assert that, overall, governments have been noxious to women’s advancement over many centuries. One century of legal emancipation would still leave Star Trek as a net positive force. But that would be a lazy argument on my part and I should simply focus on the present day. In fact, thanks to a wealth of data on wage gaps, gender norms and measures of legal institutions, I can more easily back up the claim.

My friend Rosemarie Fike of Texas Christian University is the first person that comes to mind in that regard. Her own doctoral dissertation, Economic Freedom and the Lives of Womenintroduced me to a wide literature on the role of economic freedom in the advancement of women. To be sure, Rosemarie was not the first to try to measure the role of economic freedom (which we should understand as how small and non-interventionist a government is). There had already been some research showing that higher levels of economic freedom were associated with smaller hourly wage gaps between genders and how liberalizing reforms were associated with wage convergence between genders. However, some economists have been arguing that there are other “soft sides” to economic freedom – like in the promotion of cultural equality and norms that promote certain types of attitudes. This is where Rosemarie’s work is most crucial. In a section of her dissertation, she essentially builds up on the work of (my favorite Nobel laureate) Gary Becker regarding preferences and discrimination. Basically, the idea is that free markets will penalize people who willingly discriminate. After all, if an employer refuses to hire redheads for some strange reason, I can compete by hiring the shunned redheads at a lower wage rate and out-compete him. In order to stay in business, the ginger-hating fool has to change his behavior and hire redheads which will push wages up. Its hard to be a racist or misogynist when it costs you a lot of money.

However, if you prevent this mechanism from operating (by intervening in markets), you are making it easier to be bigoted-chauvinistic-male-pigs. As a result, laws that prevent market operations (like the Jim Crow laws did for blacks) enshrine discriminatory practices. Individuals growing up in such environment may accept this as normal and acceptable behavior and strange beliefs about gender equality may cement themselves in the popular imagination. When markets are allowed to operate, beliefs will morph to reflect the actions taken by individuals (see Jennifer Roback’s great story of tramways in the US South as an example of how strong markets can be in changing behavior and see her article on how racism is basically rent-seeking). As a result, Rosemarie’s point is that societies with high levels of economic freedom will be associated with beliefs favorable to gender equality.

But the mirror of that argument is that government policies, even if their spirits have no relation to gender issues, may protect illiberal beliefs. Case in point, women are more responsive to tax rates than men – much more. In short, if you reduce taxes, women will adjust their labor supply more importantly at the extensive and intensive margin than men will. This little, commonly accepted, fact in labor economics is pregnant with implications. Basically, it means that women will work less in high tax environments and will acquire less experience than men will. Since it is also known that differences in the unmeasured effects of experience weigh heavily in explaining the remaining portion of the gender pay gap, this means that high tax rates contribute indirectly to maintaining the small gender pay gap that remains. Now, imagine what would be the beliefs of employers towards women if they did not believe that women are more likely to work fewer hours or drop out of the workforce for some time? Would you honestly believe that they would be the same? When Claudia Goldin argues that changes in labor market structures could help close the gap, can you honestly say that the uneven effect of high tax rates on the labor supply decisions of the different genders are not having an effect in delaying experimentation with new structures? This only one example meant to show that governments may, even when it is not their intent, delay changes that would be favorable to gender equality. There are mountains of other examples going the larger effects of the minimum wage on female employment to the effects of occupational licencing falling heavily on professions where women are predominant.

With such a viewpoint in mind, it is hard to say how much governments helped the cultural advancement of women (on net) over the 20th and 21st centuries . However, Star Trek clearly had a positive net effect on that cultural advancement.  That is why I am willing to say it here: Star Trek did more for the cultural advancement of women than governments did.

Why do we teach girls that it’s cute to be scared?

I just came across this fantastic op-ed while listening to the author being interviewed.

The author points out that our culture teaches girls to be afraid. Girls are warned to be careful at the playground while boys are expected… to be boys. Over time we’re left with a huge plurality of our population hobbled.

It’s clear that this is a costly feature of our culture. So why do we teach girls to be scared? Is there an alternative? This cultural meme may have made sense long ago, but society wouldn’t collapse if it were to disappear.

Culture is a way of passing knowledge from generation to generation. It’s not as precise as science (another way of passing on knowledge), but it’s indispensable. Over time a cultural repertoire changes and develops in response to the conditions of the people in that group. Routines, including attitudes, that help the group succeed and that are incentive-compatible with those people will persist. When groups are competing for resources, these routines may turn out to be very important.

It’s plausible that in early societies tribes had to worry about neighboring tribes stealing their women. For the tribe to persist, there needs to be enough people, and there needs to be fertile women and men. The narrower window for women’s productivity mean that men are more replaceable in such a setting. So tribes that are protective of women (and particularly young women and girls) would have an cultural-evolutionary advantage. Maybe Brandon can tell us something about the archaeological record to shed some light on this particular hypothesis.

But culture will be slower to get rid of wasteful routines, once they catch on. For this story to work, people can’t be on the razor’s edge of survival; they have to be wealthy enough that they can afford to waste small amounts of resources on the off-chance that it actually helped. Without the ability to run randomized control trials (with many permutations of the variables at hand) we can never be truly sure which routines are productive and which aren’t. The best we can do is to try bundles of them all together and try to figure out which ones are especially good or bad.

So culture, an inherently persistent thing, will pick up all sorts of good and bad habits, but it will gradually plod on, adapting to an ever-changing, ever evolving ecosystem of competing and cooperating cultures.

So should we still teach our girls to be scared? I’d argue no.* Economics tells us that being awesome is great, but in a free society** it’s also great when other people are awesome. Those awesome people cure diseases and make art. They give you life and make life worth living.

Bringing women and minorities into the workplace has been a boon for productivity and therefore wealth (not without problems, but that’s how it goes). Empowering women in particular, will be a boon for the frontiers of economic, scientific, technical, and cultural evolution to the extent women are able to share new view points and different ways of thinking.

And therein lies the rub… treating girls like boys empowers them, but also changes them. So how do we navigate this tension? The only tool the universe has given us to explore a range of possibilities we cannot comprehend in its entirety: trial and error.

We can’t run controlled experiments, so we need to run uncontrolled experiments. And we need to try many things quickly. How quickly depends on a lot of things and few trials will be done “right.” But with a broader context of freedom and a culture of inquiry, our knowledge can grow while our culture is enriched. I think it’s worth making the bet that brave women will make that reality better.


* But also, besides what I think, if I told parents how to act… if I made all of them follow my sensible advice, I’d be denying diversity of thought to future generations. That diversity is an essential ingredient, both because it allows greater differences in comparative advantage, but also because it allows more novel combinations of ideas for greater potential innovation in the future.

** And here’s the real big question: “What does it mean for a society to be free?” In the case of culture it’s pretty easy to say we want free speech, but it runs up against boundaries when you start exploring the issue. And with billions of people and hundreds (hopefully thousands) of years we’re looking at a thousand-monkey’s scenario on steroids… and that pill from Flowers for Algernon.

There’s copyright which makes it harder to stand on the shoulders of giants, but might be justified if it helps make free speech an economically sustainable reality. There’s the issue of yelling “Fire!” in a crowded theater, and the question of how far that restriction can be stretched before political dissent is being restricted. We might not know where the line should be drawn, but given enough time we know that someone will cross it.

And the issue goes into due process and business regulation, and any area of governance at all. We can’t be free to harm others, but some harms are weird and counter-intuitive. If businesses can’t harm one another through competition then our economy would have a hard time growing at all. Efficiency would grow only slowly tying up resources and preventing innovation. Just as there’s an inherent tension in the idea of freedom between permissiveness and protection, there’s a similar tension in the interdependence of cooperation and competition for any but the very smallest groups.

Famine and Finance: Credit and the Great Famine of Ireland

41YjUSWp3JL._SX351_BO1,204,203,200_I have recently finished reading Famine and Finance by Tyler Beck Goodspeed. While short, it should have a prominent place on the shelves of economic historians interested (obviously) in Irish history and (less obviously) in Malthusian theory.

Famine and Finance is a study of the response of Irish farmers to the potato blight. As it is known to many, many individuals simply left Ireland. However, where micro-credit was available, Goodspeed finds that farmers adapted by shifting to different types of activities – notably livestock. These areas experienced a smaller decline in population. Basically, where the institution of micro-credit was present, the demographic shock was much less severe. If only for this nuance, the book makes a sizeable contribution to the historiography of Ireland. The methods used are also elegantly simple and provide an interesting road map for anyone interested in studying the responses of local population to environmental shocks.

However, the deeper point comes from it tells us about institutions. In Goodspeed’s story, the amplitude of the collapse of the Irish population in the 19th century depends on the presence of the institution of micro-credit. Basically, the institution determined the amplitude of the shock. Since Ireland’s potato blight is often presented as the textbook case of Malthusian pressures, Goodspeed’s results are particularly interesting. In his chatper titled”Was Malthus Right?”, he shows that when controls for the institution of micro-credit is present, the typical Malthusian variables fail to explain population changes. In other words (i.e.  my words) , Malthusian pressures (the change in population) are in fact institutional failures.

This is a point I have often made elsewhere (see here, here and here and a blog post here). And because Goodspeed backs this point of mine, he has earned himself a place on my shelf of “go-to” books.

The Heights of French-Canadian Convicts, 1780 to 1830

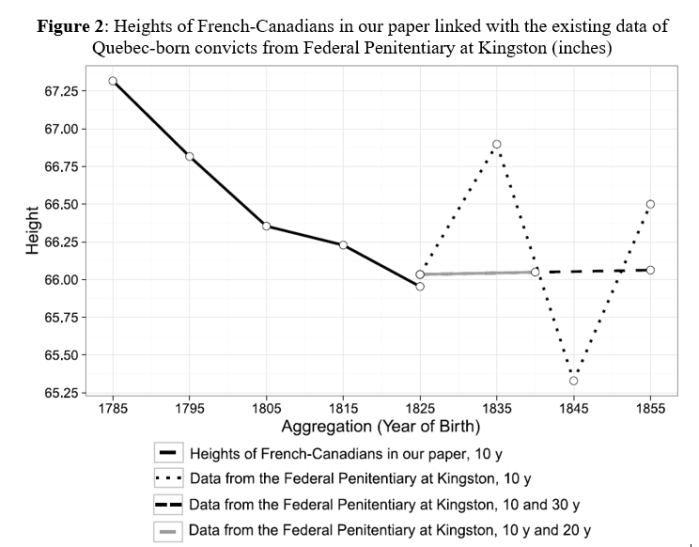
A few days ago, it was confirmed that my article with Vadim Kufenko and Alex Arsenault Morin on the heights of French-Canadians between 1780 and 1830 was accepted for publication in Economics and Human Biology. In that paper, we try to introduce French-Canadians before 1850 to the anthropometric history literature by using the records of the prison of Quebec City. Stature is an important measure of living standards. As it is heavily related to other aspects of health outcomes, it is a strong measure of biological living standards. More importantly, there are moments in history when material living standards and biological living standards move in opposite directions (in the long-run, this is not the case).

We find three key results. The first is that the French-Canadians grew shorter throughout the era when living standards did not increase importantly (and were very volatile). This puts them at odds from other places in North America where increases in stature were experienced up until the 1820s. Furthermore, stature stops falling around 1820 when economic growth picked up. This places the French-Canadians in a unique category in North America since it seems unlikely that they experienced a strong version of the antebellum puzzle (decline in stature with increases in material living standards which is what the US experienced). The second key result is that the French-Canadians are the shortest in North America, shorter even than Black Americans in slavery. However, they are considerably taller than most (save Argentinians) Latin Americans. More importantly, they are considerably taller than their counterparts in France. The third key result is related to the second key result. Today, French-Canadians are noticeably shorter than other Canadians. However, the gap was more important in the late 19th century and early 20th century. Pegged as a “striking exception” within Canada, we do not know when it actually started. Thanks to our work, we know that this was true as far back at the early 19th century.

The working paper (dramatically different than the accepted version) is here and I am posting key results in tables and figures below.  Moreover, I will be talking about anthropometric history and economic history with Garrett Petersen of Economics Detective Radio this Tuesday (I do not know when the podcast will be made available, but you should subscribe to that show anyways).

Heights.png

Table3.png

A hidden cost of the war on drugs

AI just completed another paper (this time with my longtime partner in crime Vadim Kufenko) where we question an hypothesis advanced by Samuel Bowles regarding the cost of inequality. In the process, we proposed an alternative explanation which has implications for the evaluation of the war on drugs.

In recent years, Samuel Bowles (2012) has advanced a theory (well-embedded within neoclassical theoretical elements while remaining elegantly simple) whereby inequality increases distrust which in turn magnifies agency problems. This forces firms to expend more resources on supervision and protection which means an expansion of the “guard labor force” (or supervisory labor force). Basically, he argues there is an over-provision of security and supervision. That is the cost of inequality which Bowles presents as a coordination failure. We propose an alternative explanation for the size of the guard and supervisory labor forces.

Our alternative is that there can be over-provision of security and supervision, but this could also be the result of a government failure. We argue that the war on drugs leads to institutional decay and lower levels of trust which, in turn, force private actors to deploy resources to supervise workers and protect themselves. Basically, efforts at prohibiting illicit substances require that limited policing resources be spread more thinly which may force private actors to expend more resources on security for themselves (thus creating an overprovision of security). This represents a form of state failure, especially if the attempts at policing these illicit substances increase the level of crime to which populations are vulnerable. To counteract this, private actors invest more in protection and supervision.

Using some of the work of Jeffrey Miron and Katherine Waldock, we show that increases in the intensity of prohibition enforcement efforts (measured in dollars per capita) have significant effects on the demand for guard labor. Given that guards represent roughly 1 million individuals in the US labor market, that is not a negligible outcome. We find that a one standard deviation increase in the level of drug enforcement efforts increases the ratio of guards to the population by somewhere between 12.92% and 13.91% (which is the equivalent of roughly 100,000 workers).

While our paper concentrated on proposing an alternative to the argument advanced by Bowles regarding the cost of inequality, we (more or less accidentally) measured a hidden cost from the war on drugs. The insecurity (increased crime rates and spillovers from illegal markets into formal markets) brought forth by drug prohibition  forces an over-provision of security and supervision (our supervision measure which includes workers that supervise other workers were smaller than with the security guard measure).

Basically, a hidden (private cost) of the war on drugs is that we must reallocate resources that we could have used otherwise. Its a little like when I say that it is meaningless to compare healthcare expenditures to GDP in Canada and the United States because Canadians assume costs in a hidden manner through rationing. Waiting lists in Canada are longer than in the US. The cost is lost wages and enduring pain and that cost will not appear in measures of expenditures to GDP. The war on drugs works the same way. There is a fiscal cost (expenditures dedicated to it and the taxes that we must impose), there is a crime cost (destruction of lives and property) and there is a reallocation cost of privately providing security which is hard to measure.

*The paper is available here. 

The Enforcement Costs of Immigration Laws are Greater than Alleged Welfare Costs

As I mentioned in my note yesterday, the common argument that immigration is significantly costly through welfare is mostly empirically falsified. The fact of the matter is immigrants usually aren’t qualified for such programs, illegal immigrants mostly cannot and do not receive them, and immigrants as a whole wind up contributing more to the government’s balance sheet through economic growth and tax receipts than they take through welfare transfer payments.

However, there is one fact I neglected to mention yesterday worthy of its own post: if those opposed to immigration on the grounds of welfare costs were really sincere in that argument, they also need to consider the fiscal costs of enforcing their beloved immigration laws. As the New York Times editorial board pointed out yesterday, these costs are not insignificant:

The Migration Policy Institute reported in 2013 that the federal government spends more each year on immigration enforcement–through Immigration and Customs Enforcement and the Border Patrol–then on all other federal law enforcement agencies combined. The total has risen to more than $19 billion a year, and more than $306 billion in all since 1986, measured in 2016 dollars. This exceeds the sum of all spending for the Federal Bureau of Investigation; the Drug Enforcement Administration; the Secret Service; the Marshals Service; and the Bureau of Alcohol, Tobacco, Firearms, and Explosives.

These fiscal costs get worse when you consider that Donald Trump wants to expand ICE’s budget even further and, of course, the $8-$12 billion dollar wall.

Further, if you are a civil liberties type concerned with the social and fiscal costs of mass incarceration, immigration enforcement looks even bleaker:

ICE and the Border Patrol already refer more cases for federal prosecution than the entire Justice Department, and the number of people they detain each year (more than 400,000) is greater than the number of inmates being held by the Federal Bureau of Prisons for all other federal crimes.

The war on immigrants makes the war on drugs look tame.

Of course, these costs are pretty small when compared to the welfare state, but immigrants are not the ones driving up those welfare costs and they might even reduce it with more tax receipts. The truth is that furthering immigration restrictions and enforcement is truly fiscally irresponsible, not respecting the right to freedom of movement and contract.

Welfare Costs are not a Good Argument Against Immigration

Note: A version of this was initially posted on my old, now defunct blog. However, has become increasingly relevant in the age of Trump, and is worthy of reconsideration now.

It’s one of the most common arguments against looser immigration going back to Milton Friedman to Donald Trump. It is commonly claimed that even though loosening immigration restrictions may be economically beneficial and just, it should be opposed due to the existence of the welfare state. Proponents of this claim argue that immigrants can simply come to this country to obtain welfare benefits, doing no good for the economy and adding to budget deficits.

Though this claim is on its face plausible, welfare is not nearly as much of a compelling reason to oppose immigration as so many argue. It is ultimately an empirical question as to whether or not the fiscal costs of immigration significantly outweigh the fiscal benefits of having more immigrants pay taxes and more tax revenue economic growth caused by immigration.

Before delving into the empirical studies on the matter, there is one very important fact that is too often neglected in these discussions: there are already heavy laws restricting all illegal immigrants and even the vast majority of legal ones from receiving Welfare. As the federal government itself–specifically the HHS–notes:

With some exceptions, “Qualified Aliens” [ie., legal immigrants] entering the country after August 22, 1996, are denied “Federal means-tested public benefits” for their first five years in the U.S. as qualified aliens.

If we were to allow more immigrants, there are legal mechanisms stopping them from getting welfare. There are some exceptions and even unlawful immigrants occasionally slip through the cracks, but this is already a major hole in the case that welfare means we should hold off on immigration reform. The vast majority of immigrants cannot receive welfare until years after they are legalized.

However, for the sake of argument, let us ignore that initial hole in the case against increased immigration. Let’s generously assume the majority of immigrants–legal and illegal–can somehow get their hands on welfare. There is still little reason to expect that additional immigrants would be any more of a fiscal drag on welfare programs for the vast majority of our population simply because they are not the type of people who typically wind up on welfare. Our welfare programs are primarily designed to protect a select few types of people: the sick and elderly (Social Security and Medicare), and women and children (SCHIP, SNAP, TAMPF, etc.) If one looks at the demographics of immigrants coming into the country, however, one finds that they do not fit in the demographics of those who typically qualify for welfare programs. According to the Census Bureau, the vast majority (75.6%) of the total foreign-born population (both legal and illegal immigrants) are of working age (between 25 and 65).  Most immigrants, even if they were legal citizens, would not qualify for most welfare programs to begin with.

On the other hand, poverty rates are higher among immigrants and that means more would qualify for poverty-based programs. However, most immigrants are simply not the type to stay in those programs. Contrary to common belief, immigrants are mostly hard-working innovators rather than loafing welfare queens. According to Pew Research, 91% of all unauthorized immigrants are involved in the US labor force. Legal immigrants also start businesses at a higher rate than natural born citizens and file patents at almost double the rate of natives. As a result, immigrants have fairly high social mobility, especially intergenerationally, and so will not stay poor and on welfare all that long.

Put it together, and you find that immigrants generally use many major welfare programs at a lower rate than natives. Immigrants are 25% less likely to be enrolled in Medicare, for example, than citizens and actually contribute more to Medicare than they receive while citizens make Medicare run at a deficit. From the New York Times:

[A] study, led by researchers at Harvard Medical School, measured immigrants’ contributions to the part of Medicare that pays for hospital care, a trust fund that accounts for nearly half of the federal program’s revenue. It found that immigrants generated surpluses totaling $115 billion from 2002 to 2009. In comparison, the American-born population incurred a deficit of $28 billion over the same period

Of course, nobody would advocate restrictions on how many children are allowed to be born based on fiscal considerations. However, for some reason the concern becomes a big factor for immigration skeptics.

If you are still not convinced, let us go over the empirical literature on how much immigrants cost fiscally. Some fairly partisan studies, such as this one from the Heritage Foundation (written by an analyst who was forced to resign due to fairly racist claims), conclude that fiscal costs are very negative. The problem, however, is that most of these studies fail to take into account the dynamic macroeconomic impact of immigration. Opponents of immigration, especially those at the Heritage Foundation, generally understand the importance of taking dynamic economic impacts of policy changes into account on other issues, e.g. taxation; however, for some (partisan) reason fail to apply that logic to immigration policies. Like taxes, immigration laws change people’s behavior in ways that can increase revenue. First of all, more immigrants entering the economy immediately means more revenue as there are more people to tax. Additionally, economic growth from further division of labor provided by immigration increases tax revenue.  Any study that does not succeed in taking into account revenue gains from immigration is not worth taking seriously.

Among studies that are worth taking seriously, there is general consensus that immigrants are either a slight net gain fiscally speaking, a very slight net loss or have little to no impact. According to a study by the OECD of its 20 member countries, despite the fact that some of its countries have massive levels of immigration, the fiscal impact of immigration is “generally not exceeding 0.5 percent of G.D.P. in either positive or negative terms.” The study concluded, “The current impact of the cumulative waves of migration that arrived over the past 50 years is just not that large, whether on the positive or negative side.”

Specifically for the United States, another authoritative study in 1997 found the following as summarized by David Griswold of the Cato Institute:

The 1997 National Research Council study determined that the typical immigrant and descendants represent an $80,000 fiscal gain to the government in terms of net present value. But that gain divides into a positive $105,000 fiscal impact for the federal government and a negative $25,000 impact on the state and local level (NRC 1997: 337).

Despite the slight negative impact for states, as Griswold notes, there is no correlation between immigration and more welfare for immigrants:

Undocumented immigrants are even more likely to self-select states with below-average social spending. Between 2000 and 2009, the number of unauthorized immigrants in the low-spending states grew by a net 855,000, or 35 percent. In the high-spending states, the population grew by 385,000, or 11 percent (U.S. Census 2011; NASBO 2010: 33; Passel and Cohn 2011). One possible reason why unauthorized immigrants are even less drawn to high-welfare-spending states is that, unlike immigrants who have been naturalized, they are not eligible for any of the standard welfare programs.

The potential fiscal impact of immigration from the Welfare state is not a good reason to oppose it at all. There are major legal barriers to immigrants receiving welfare, immigrants are statistically less likely to receive welfare than natives for demographic reasons, and all the authoritative empirical evidence shows that immigrants are on net not a very significant fiscal drag and can, in fact, be a net fiscal gain.

Inequality and Regional Prices in the US, 2012

I have just completed a short piece on the impact of regional prices on the measurement and geographic distribution of low income individuals. Basically, Youcef Msaid and myself* used the March 2012-CPS data combined the BEA’s regional purchasing power parities database to correct incomes.

We found is that the level of inequality is very modestly overestimated (0.5%). Now this is a conservative estimate since we used state-level corrections for price differences. This means that we took price corrections for New York state as a whole even if there are wide differences within New York state. Obviously, with more fine-grained price-level adjustments we would find a bigger correction but it is hard to imagine that it could surpass 1-3%.

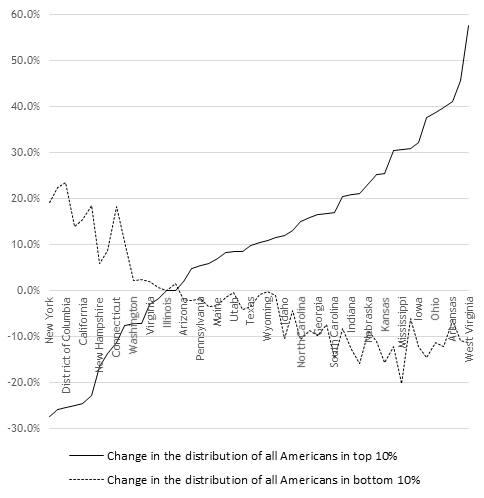
That was not our most important result. Our most important result relates to where the bottom decile of the income distribution is geographically located. We find that instead of being found disproportionately (relative to their share of the total US population) in poorer states, the bottom decile is disproportionately found in rich states. The dotted black line in the figure below illustrates the change in the number of individuals who are, nationally, in the bottom 10%. New York and California have significant increases while West Virginia has a large decrease. The dark black line shows the same for the top 10%.

fig2

Another way to grasp the magnitude of this change is to relate the change to the population shares of each decile by state. For example, New York had 6.29% of the US population in 2012 and 6.61% of all Americans in the bottom 10% of the income distribution before adjusting for regional purchasing parities. After adjusting however, New York’s share of the bottom 10% surges to 7.88%.

Why does it matter? Because most of the cost difference adjustments come from differences in housing costs. The first obvious point is that housing is a crucial aspect of any discussion of inequality. The second, but less obvious point,  is that these differences are massive barriers to migration within the United States and the poorest are those for whom these barriers are the heaviest. Unfortunately, the high-cost areas are also high-productivity areas (New York, San Francisco for example) whose high costs are largely the result of restrictions on the supply of housing. This means that high-productivity areas – which would raise the wages of low-skilled and low -income workers are inaccessible to them. It also means that those who were present before the increase in productivity of these areas capitalized the gains in more valuable real estates (even if this means lower real incomes).

In this light, the geographic reallocation of the bottom 10% is consistent with an emerging literature that argues that inequality is in great a result of housing policy (see notably Rognlie’s reply to Piketty in the Brookings Papers).  This small modification (I consider it small) that me and Youcef made has important logical ramifications.

* Thank you to my friends Rick Weber (who blogs here at NOL and whose research can be seen here) and Ryan Murphy (whose research can be found here) who provided good comments to bring the paper to the stage where we are ready to submit.

Wedding date and superstitions

There is a neat new paper in the most recent edition of the Journal of Population Research by Gabriele Ruiu and Marco Breschi on wedding dates and superstitutions in Italy. Here is the abstract:

In Italy, it is believed that Tuesdays and Fridays are particularly unlucky days for weddings as well as the 17th day of each month. Previous studies realized in the aftermath of the Second World War have shown the strong influence that these superstitions had in determining the wedding dates in the entire country. We have used exhaustive data collection of all marriages celebrated in Italy in the years 2007–2009 to investigate whether superstitions are still able to influence the choices of spouses. We find that this influence is still present after the great economic, social and demographic transformation of Italian society. We also show that a wife’s education reduces the influence of superstition on the choice of the date of marriage while those who opt for a religious rite are also those who are more careful in avoiding inauspicious days.

How Canada Tracked the US during the Great Depression

Over the last few years, while I continued my research on other fronts, I started spending small amounts of time on a daily basis to read about the Great Depression and more precisely, how Canada lived through the depression.

Since the old adage is that Canada gets pneumonia when the US gets the flu, I thought that it was a worthy endeavor (although Pedro Amaral and James McGee have been working on that front) to try to see what insights we can derive from looking at Canada’s experience during the Great Depression (especially since it had a very different banking system).

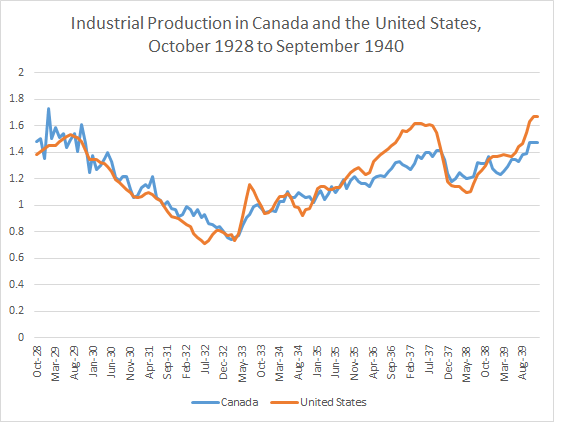
In the process, I managed to collect in a datasheet, the Industrial Production Index of Canada (consisting largely of heavy industry with some light industries and utilities, making it a relatively well-rounded index). This is what it looks like.

industrialproduction

Other than seeing Canada’s experienced mirrored in the US experience (except for the 1935-1937 window), I am not sure what to make of it. However, I thought it worthwhile to share that information publicly.

Once, Cubans were (maybe) richer than Americans

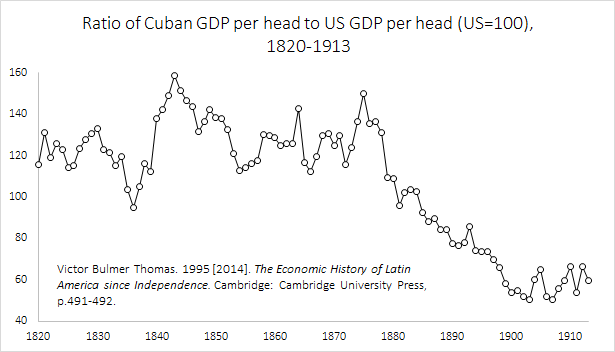
In light of what we see today, this is hard to believe. However, as a result of Castro’s death, I accidentally became interested in the history of this fascinating island and the more I discover, the more shocked I am at “the path” that Cuba has taken. One of these reasons is provided below by Victor Bulmer Thomas in his Economic History of Latin America since Independence. Now, Thomas uses a different approach than the commonly used Maddison data (he believes the assumptions are too heroic). He uses indicators correlated with GDP per capita to fill in the gaps and he finds that Cuba was generally richer than the United States for most of the 19th century (see below):

cubaus

Now, I am not convinced by the figure Thomas presents. However, I am also skeptical of the levels presented by Maddison (where Cuba is roughly 60% as rich as the US in 1820). In between are some more reasonable estimate (see this great discussion in this book as well as this discussion by Coatsworth).  Moreover, there is the  issue of slavery which distorts the value of using GDP per capita because of high levels of inequality (however, it distorts both ways since the US was also a slave economy up to the Civil War).

Nonetheless, this tells you about the “path not taken” by Cuba.

Household size and growth since 1870 (albeit in Canada)

Two days ago, I posted something on how much we were estimating growth since the 1950s. While organizing another research paper that I am trying to finish, I realized that I could make a follow-up to this based on previous research of mine.

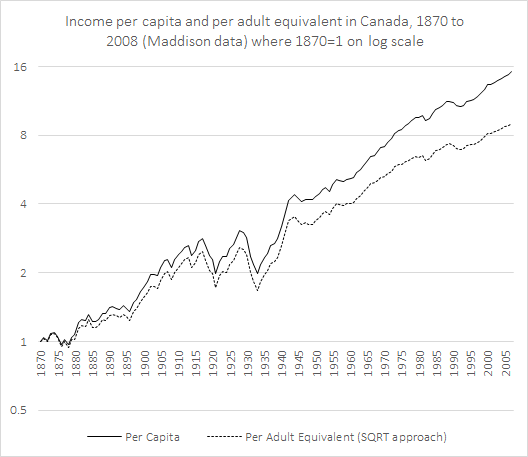
A few months ago, I published (alongside Vadim Kufenko and Klaus Prettner) a short note in Economics Bulletin where we showed that the large differences in household size in Canada that existed up to 1975 led many to overestimate the level of differences between provinces. Moreover, we pointed out that because household size were converging at the same time as incomes, we argued that the rate of convergence from 1945 onwards was slightly overestimated. That paper convinced us to do the same between all the OECD countries (we are assembling the data right now).  But this was an argument about variance, what if we simply plot the “per capita” income of Canada with the “per adult equivalent” income of Canada since 1870.

By using the Maddison dataset combined with the data from my article, it took me a few seconds to get the graph below. What is important to notice in this graph is that, incomes per adult equivalent (measured in 1990 Geary-Kheamis dollars) have increased 40% less than incomes per person. Since adult equivalents are a better measure of living standards (because you capture the economies of scale associated with household size), we can easily say that we have been underestimating the level of improvement in Canada (it is still substantial however).

growthfactors

“Watch” the (industrial) revolution!

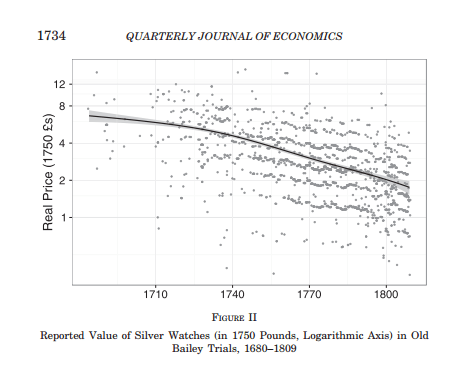
I don’t know how I missed such a valuable article, but O’Grada and Kelly have this fascinating piece on the price of watches in England from the early 18th century to the early 19th century in the Quarterly Journal of EconomicsStarting from Adam Smith’s quote that the price of watches had fallen 95% over roughly one hundred years, they collected prices of stolen watches reported in court records.  They find that Smith was wrong. The drop was only 75% (see the sarcasm here).

watch-prices

Why is this interesting? Because it shows something crucial about the industrial revolution. This was a complex good to build which required incredible technical advances – many of which could be considered general purpose technologies which could then be used by other industries for their own advances (on the assumption that other entrepreneurs noticed these technologies). But, more importantly, it provides further evidence against the pessimistic view of living standards in Britain at the beginning of the Industrial Revolution. These “new” goods became incredibly cheaper. Along with nails, glass, pottery and shipping , watches did not weigh heavily in the cost of living of the British. However, they did weigh heavily as industrial prices which meant that costs of production were falling progressively which augured well for the beginning of the industrial revolution*.

Literally, you can watch the industrial revolution in that paper! (sorry, bad pun)

* By the way, I use the term because it is conventional but a revolution is a clean break. The British industrial revolution was not saltation as much as it was a steady process of innovation from the early 18th century up to the mid 19th century. The real “revolution” in my eyes is that of the late 19th century. The technological changes from 1870 to 1890 are the most momentous in history and if there was any technological revolution in the past, this was it.

Did the Thirty Glorious Years Actually Exist?

Okay, I am going for a flashy title here. I should have asked whether the Thirty Glorious were as glorious as they are meant to be. This is a question that matters in debates about both inequality and the often-bemoaned growth slowdown.

In the past (say before 1950), labor force participation was quite low (relative to today) by virtue of large family sizes and most married women not working. However, when they were at-home, these married women produced something. That something was simply not included in our national accounts. When they entered the labor force, they produced less of that something. However, since it had never been measured, we never subtracted that something from the actual output generated from their increased participation.

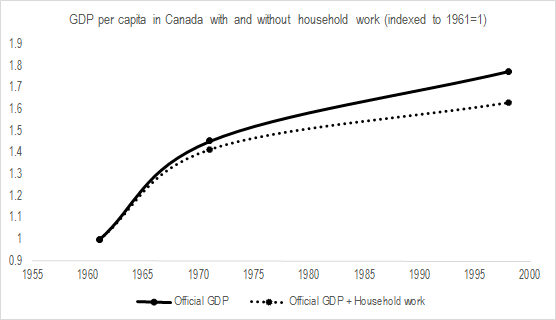
Even before the 1950s, this mattered considerably as growth tended to be heavily underestimated (by 0.3 percentage points from 1870 to 1890, overestimated by 0.38 points from 1890 to 1910 and by 0.06 percentage points from 1910 to 1930).This was at a time when variations between the household economy and the market economy were small. Imagine the importance of overestimates since the 1950s! In a short comment reply to Emily Skarbek last year, I pointed out that adjusting for the size of the household economy meant that 1/7th of Canada’s economic growth from 1960 to 1997 (see image below and this was before one additional surge of labor participation resulting from daycare and unemployment policy reforms).

SEcularStagnation2

Recently, I found an old book in my library. It is Kenneth Boulding’s Structure of a Modern EconomyIn it, he makes this exact same argument. Basically, actual output today is overestimated relative to output in the past. And there are many, many, many other articles on this. In all cases, the rate of growth is heavily reduced. In a way, that means that the Thirty Glorious are less glorious (which makes the growth stagnation argument seem more defensible).

And you know what? This is consistent with attempts to correct inequality measures. Most of the attempts made to correct inequality for age, number of workers per household, the size of household and prices, they generally increase very modestly the income growth of the bottom centiles and decrease appreciably the actual level of growth of incomes at the top. While these corrections reduce the level of inequality (and the growth thereof), they also reduce the growth rate of incomes.

Is it possible that the correction to make inequality measures more comparable over time are allow us to see the point about overestimating growth since the 1950s? It means that the Thirty Glorious aren’t that glorious (at the very least, they’re overestimated). It also means that someone who could follow some of the proposed corrections to national income accounts (generally, the best source for this is the Review of Income and Wealth) for every year since 1929 (starting date of the US national accounts which could be extended by using Kuznets’s national income measures from 1913 to 1929) could propose the “actual output” of the country and see how glorious the 1945-1975 period was. That is the work of economic historians to do!

On immigration, trade, and inequality: why nobody should care (that much)

Recently, I read snippets from George Borjas’s book, We Wanted Workers (I got distracted and reverted to reading Leah Platt Boustan’s Competition in the Promised Land).On its heels came this article by Dani Rodrik in Foreign Policy. Both work make the same case, that free movement of goods and people may imply some negative effects on inequality. Borjas argues that immigration increases inequality while Rodrik argues that low-skilled workers are displaced.

Both arguments are not convincing.

First of all, immigration will always increase inequality in one area. This is by definition. Unless the migrants follow the same distributional pattern as the host population, inequality will increase. If somebody from Cuba enters the United States at the tenth percentile, he increases inequality by swelling the ranks of low earners. If somebody from China enters the United States at the 90th percentile, he increases inequality by swelling the ranks of the high earners. However, from a global perspective (world population), inequality has actually dropped since the migrant has a greater income than in the past. After all, bringing a Haitian to the US may increase US inequality measures but the ten-fold increase in his income (this number comes from my colleague Ben Powell) means that worldwide inequality drops.

To be honest, I know that Borjas is probably aware of this point, but many of those who spin his work don’t get it. Borjas’s argument is little more sophisticated. His claim is that low-skilled workers (high school dropouts) see their wages go down while everybody else (high school graduates and university graduates) gains from immigration. This increases inequality because they are left behind economically. But this is where his argument is alike that of Rodrik and where it misses the target dramatically.

While I could be lazy and simply say that many other scholars place Borjas at the extreme of the spectrum of academics with regards to the effects of immigration on labor markets. Indeed, there are more scholars who find that low-skilled workers also gain from immigration all things being equal. But, I won’t be lazy. Let me assume, for the sake of argument, that the empirical result is valid. If unskilled workers are displaced, why can’t they find new employment elsewhere. If the effects of immigration are so positive for everybody else, it means that everybody else is substantially richer and they can demand more goods. Are there barriers preventing the unskilled from acquiring jobs? The answer is emphatically yes.

The ability to find a new form of employment following changes in the labor market depends on the frictions that exist on the labor market. Some of them are natural. We have to assume search costs (time, energy, some money) to look for a job and get the training for that job. But there are also barriers that create unnecessary frictions. The rise of occupational licencing is one of those (growing) frictions (see here, here and here). We could also point out that product regulations tend to affect the prices of goods that weigh more heavily in the consumption baskets of lower-income workers (here and here) thus pulling the poorest down. We could also point to the fact that states with right to work laws seem to have enjoyed more limited increases in inequality than the states without such laws (here). We could also underline the fact that housing regulations are making it harder for unskilled workers to move to dynamic areas, thus locking them in low-productivity areas (here). And the list could go on for a few more pages, but I think the point is made: there are tons of factors that make displacement a problem. However, those who worry about it when it comes from changes resulting from trade or immigration are concerned with a minor (and positive in the long-run) variable. In a way, Borjas and Rodrik are (rightfully) concerned about the poorest but they fail to identify the problem like if a doctor was concerned with his patient’s loss of sight rather than concentrating on the brain tumor that caused the loss.

Free trade and open borders generate massive benefits. But there are short-term costs as production methods and resources are being reallocated. Many government policies amplify exponentially these costs and delay reallocation. This creates the inequality they bemoan.