Not all GDP measurement errors are greater than zero!

Bryan Caplan is an optimist. He thinks that economists do many errors in estimating GDP (overall well-being). He is right in the sense that we are missing many dimensions of welfare improvements in the last half-century (see here, here and here). These errors in measurements lead us to hold incorrectly pessimistic views (such as those of Robert Gordon). However, Prof. Caplan seems to argue (I may be wrong) that all measurements problems and errors are greater than zero. In other words, they all cut in favor of omitting things. There are no reasons to believe this. Many measurement problems with GDP  data cut the other way – in favor of adding too much (so that the true figures are lower than the reported ones).

Here are two errors of importance (which are in no way exhaustive): household output and adjustments for household size.

Household Output

From the 1910s to the 1940s, married women began to enter moderately the workforce. This trickle became a deluge thereafter. National GDP statistics are really good at capturing the extra output they were hired to produce. However, national GDP statistics cannot net out the production that was foregone: household output.

A married woman in 1940 did produce something: child-rearing, house chores, cooking, allowing the husband to specialize in his work. That output had a value. Once offered the chance to work, married women thought the utility generated from producing “home outputs” was inferior to the utility generated from “market work”. However, the output that is measured is only related to market work. Women entered the labor force and everything they produced was considered a net addition to GDP. In reality, any economist worth his salt is aware that the true improvement in well-being is equal to the increased market output minus the forsaken house output. Thus, in a transition from a “male-labor force” to a “mixed labor force”, you are bound to overestimate output increases.

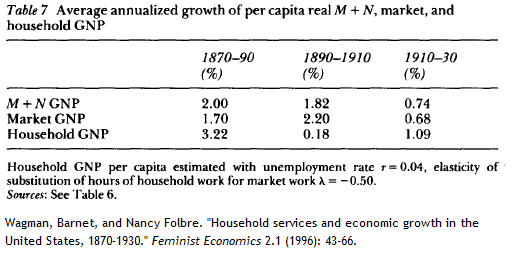
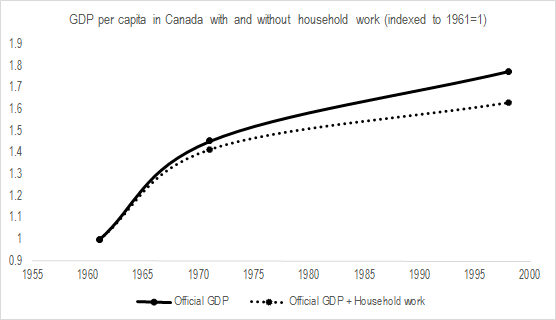
How big of an issue is this? Well, consider this paper from 1996 in Feminist Economics. In that paper, Barnet Wagman and Nancy Folbre calculate output in both the “household” and “market” sectors. They find that even very small changes in the relative size of these sectors alter growth rates by substantial margins. Another example, which I discussed in this blog post based on articles in the Review of Income and Wealth, is that when you make the adjustment over four decades of available Canadian data, you can find that one quarter of the increase in living standards is eliminated by the proper netting out of the value of non-market output. These are sizable measurement errors that cut in the opposite direction as the one hypothesized by prof. Caplan (and in favor of people like prof. Gordon).

Household Size

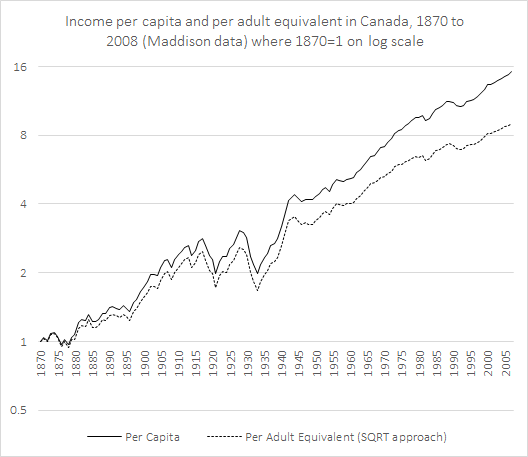
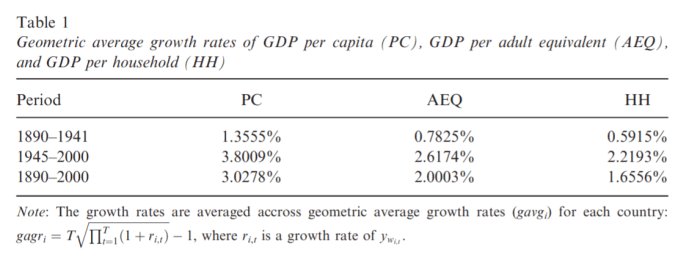
Changes in household sizes also create overestimation problems. Larger households have more economies of scale to exploit than smaller households so that an income of $10,000 per capita in a household of six members is superior in purchasing power than an income of $10,000 per capita in a single-person household. If, over time, you move from large households to small households, you will overestimate economic growth. In an article in the Scottish Journal of Political Economy, I showed that making adjustments for household sizes over time yields important changes in growth rates between 1890 and 2000. Notice, in the table below, that GDP per adult equivalent (i.e. GDP per capita adjusted for household size) is massively different than GDP per capita. Indeed, the adjusted growth rates are reduced by close to two-fifths of their original values over the 1945-2000 period and by a third over the 1890 to 2000 period. This is a massive overestimation of actual improvements in well-being.

HouseholdAdjust

A large overestimation

If you assemble these two factors together, I hazard a guess that growth rates would be roughly halved (there is some overlap between the two so that we cannot simply sum them up as errors to correct for – hence my “guess”). This is not negligible. True, there are things that we are not counting as Prof. Caplan notes. We ought to find a way to account for them. However, if they simply wash out the overestimation, the sum of errors may equal zero. If so, those who are pessimistic about the future (and recent past) of economic growth have a pretty sound case. Thus, I find myself unable to share Prof. Caplan’s optimism.

Household size and growth since 1870 (albeit in Canada)

Two days ago, I posted something on how much we were estimating growth since the 1950s. While organizing another research paper that I am trying to finish, I realized that I could make a follow-up to this based on previous research of mine.

A few months ago, I published (alongside Vadim Kufenko and Klaus Prettner) a short note in Economics Bulletin where we showed that the large differences in household size in Canada that existed up to 1975 led many to overestimate the level of differences between provinces. Moreover, we pointed out that because household size were converging at the same time as incomes, we argued that the rate of convergence from 1945 onwards was slightly overestimated. That paper convinced us to do the same between all the OECD countries (we are assembling the data right now).  But this was an argument about variance, what if we simply plot the “per capita” income of Canada with the “per adult equivalent” income of Canada since 1870.

By using the Maddison dataset combined with the data from my article, it took me a few seconds to get the graph below. What is important to notice in this graph is that, incomes per adult equivalent (measured in 1990 Geary-Kheamis dollars) have increased 40% less than incomes per person. Since adult equivalents are a better measure of living standards (because you capture the economies of scale associated with household size), we can easily say that we have been underestimating the level of improvement in Canada (it is still substantial however).

growthfactors

Women and secular stagnation

As an economic historian, I’ve always had a hard time with the idea of secular stagnation. After all, one decade of slow growth is merely a blip on the twelve millenniums of economic history (I am not that interested with the pre-Neolithic history, but there is some great work to be found in archaeology journals). Hence, Robert Gordon’s arguments fall short on me.

That was until I was sparked to react to a comment by Emily Skarbek at Econlib. Overall, she is skeptical of Gordon’s claims of secular stagnation. But not for the same reasons. She claims that there are many improvements in welfare that we are not capturing through national income accounts. This is basically the same point as the one made by the great Joel Mokyr (the gold standard of economic historians).

It is true that national accounts have some large conceptual problems regarding measuring output when there are massive technological changes. Yet, all these problems don’t go in the same direction. More precisely, they don’t all lead to underestimation of growth.

My favorite example of one that leads us to overestimate growth is the one I keep giving my macroeconomics students at HEC Montreal. Assume an economy with a labor-force participation rate of 50%. Basically, only males work. All women stay at home for household chores and childcare. In that case, all measured output is male-produced output. Since national accounts don’t consider household production, all the output of women in the households of this scenario is non-existent.

Now assume a technological change causing a shift of 10% of women to the workforce at the same wage rate as men. That boosts labor participation rate to 55% and output by 5%. However, that would largely overestimate growth caused by this shift. After all, when my grandmothers were raising my parents, they were producing something. It was not worthless output. Obviously, if my grandmothers went to work, there was some net added value, but not as much as 5%. However, according to national account, the net increase in GDP is … 5%.

Obviously wrong right? Now, think of the economic history of the last 100 years. Progressively, female labor-force participation increased as marriages were delayed and family sizes were reduced. Unmarried women stayed on the market longer. Then, the introduction of new household technologies allowed some married women to join the labor force more actively. Progressively, women accumulated more human capital and became more active in the labor force. So much that in many western countries, both genders have equal labor-force participation rates.

As they shifted from household production to market production, we considered that everything they did was a net added value. We never subtracted the value of what was produced before. Don’t get me wrong, I am happy that women work instead of toiling inside a household to handwash dirty clothes. Yet, it would be both statistically incorrect and morally insulting to say that what women did in the household had no value whatsoever. 

The role of household production in reducing the quality of growth estimates goes back to the 1870s! A 1996 article in Feminist Economics (which I use a lot in my own national account sections of macroeconomics classes) shows the following changes in growth rates when we account for the value of household production. Instead of increasing to 1910 and then falling to 1930, growth in the United States falls to 1930. While the growth rates remain appreciable, they nonetheless indicate a massively different interpretation of American economic history.

SecularStagnation


Sadly, I do not possess a continuation of such estimates to later points in time for the United States. I know there is an article by the brilliant Valerie Ramey in the Journal of Economic History, but I am not sure how to compute this to reflect changes in overall output. I intend to try to find them for a short piece I want to submit later in 2016. Yet, I do have estimates for my home country of Canada. Combining a 1979 paper in the Review of Income and Wealth with a working paper from Statistics Canada, it seems that the value of household production falls from 45% of GNP in 1961 to 33% in 1998. When we adjust GDP per capita to consider the changes in household work in Canada, the growth path remains positive, but it is less impressive.

SEcularStagnation2

I am not saying that Gordon is right to say that growth is over. I am saying that the accounting problems don’t all go in the direction of invalidating him. In fact, if my point is correct, proper corrections would reduce growth rates dramatically for the period of 1945 to 1975 and less so for the period that followed. This may indicate that “slow growth” was with us for most of the post-war era. That’s why I reacted to the blog post of Skarbek.

It also allows me to say the thing that is the best buzz-kill for economics students: national accounting matters!