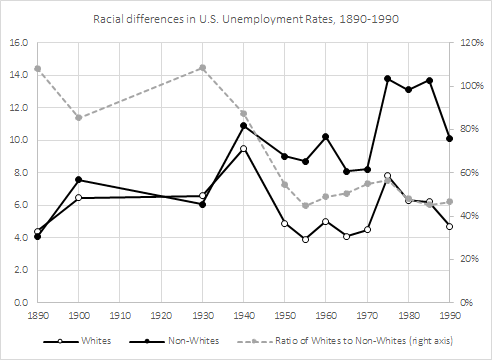
Prices in Canada, 1688 to 2015

I have just finished my working paper creating a price index for Canada that covers the period from 1688 to 1850 in order to link with the existing datasets that cover up to 2015. Here is the result (and the paper is currently consideration for publication). The paper is here and it shows how much prices have changed in Canada since the late 17th century.

pricescanada

Sons outearning Fathers in Chetty et al. : working hours should be considered

In response to my post yesterday, my friend and economist/nuclear engineer (great mix) Laurent Béland pointed out that the Father-Sons mobility figures in Chetty et al. are depressing. Yes, at first glance, they are (see below – the red line). fathersons

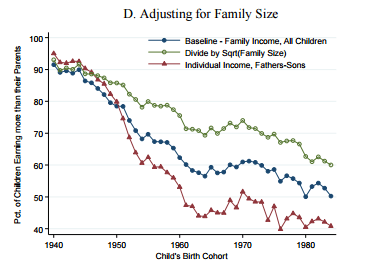
But, at second glance, it is not as terrible. Think about family structures with the 1940 birth cohorts. The father works and, in most likelihood, the mother is a stay-at-home father. Most of the earnings come from the father who probably works 45 to 60 hours a week.  If my father earns 40,000$ at 60 hours a week or earn 40,000$ at 40 hours a week, the line remains at the same height, but we are not talking about the same living standard in reality. Chetty et al. do not account for hours worked to achieve income.  The steep decline – faster than the baseline of household-size adjusted decline – matches the steep increase in female labor force participation and the decline labor force participation of males (see graph here and Nicolas Eberstadt’s work here) as well as the decline in hours worked by males.

If the question had been “what are your chances of out-earning your father per hour worked”, then the red line would not have fallen like that. Income divided by labor supplied would probably bring the red-line back with the blue-line.

Note: Again, please note that I am not trying to rip apart Chetty et al. (as some have claimed elsewhere). Their work is great and as a guy who does all his research on providing data series regarding economic history, I am never going to rip on someone who does hard data work like Chetty et al. did ! My point is that I am not convinced that the decline is so big. And, in good faith, it seems that Chetty et al. do try to put the “caution” labels where its needed – and its important to discuss those caution labels before some politician or two-cents-pundit goes all Trump on us by saying stuff that this doesn’t say!

A flaw regarding the chance of “out-earning” your parents

When Raj Chetty publishes a paper, it generally comes with a splash. The last one is no exception. His paper (co-authored), picked up by David Leonhardt at the New York Times and Justin Wolfers on Twitter, basically measures the American dream : what are your chances to do better than your parents. The stunning conclusion is that someone born in 1940 had a 90%+ chance of “out-earning” his parents compared with a few points above 50% for those born in the 1980s. I am not convinced. Well, when I am not convinced, I am saying I am not convincing about how big the drop is! I think the drop is smoother (the slope of decline is gentler) and the starting point for the 1940 cohort is too high.  As a big fan of Chetty, I must press this point.

More precisely, I am saying that the bar (income threshold) over which someone had to jump in 1940 is underestimated and overestimated in 1980. Setting the bar too low (high) means very high (low) chances of “out-earning” your parents. To set the bar too low, you must underestimate (overestimate) the income of the parents.  This could occur if household economies of scale are not accounted for.

An income of 30,000$ for 3 persons is not the same as an income of 60,000$ for 6 peoples. On a per capita basis, the income is the same. But, if you adjust for economies of scale in housing and furnitures, there are differences (the simplest is square root).  This gives you income per adult equivalent. Chetty et al. are aware of that and they provided a sensitivity analysis which is not mentioned by those who are relaying the article. Since household size has tended to fall over time, the growth in per capita income is faster than the growth in income per adult equivalent (a better measure). Any correction for this long-term demographic trend would attenuate the slope of the decline of the chance to out-earn your parents. And indeed, once Chetty et al. make the correction, the decline is much more modest (but still present – see below).

size

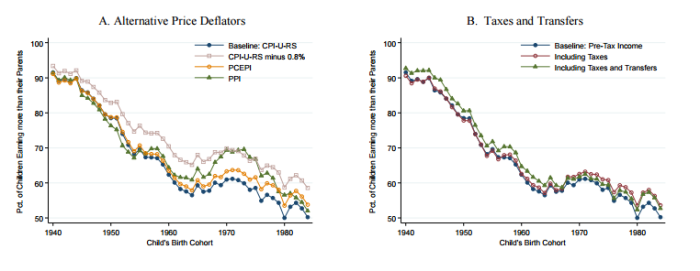
Simultaneously, Chetty et al. also present other important sensitivity checks. All of them relevant. But, in a strange decision, Chetty et al. decided to isolate each of the sensitivity checks rather than compile them. Taken individual, they all seem minor – except adjusting for family size. But compound this with the other sensitivity check proposed by Chetty et al.: price deflators. Using the well-known bias in the the CPI that overestimates inflation by 0.8%, Chetty et al. find that, by the end of their perod, there is roughly a ten percentage point difference between the baseline uncorrected CPI and the corrected CPI (see below). Compound this with the corrections for family and you still get a decline – but again the slope of the decline is much more modest. If you add panel B from figure 3 in Chetty et al – which includes taxes and transfers – you probably get a few extra points up. There will still probably be a decline, but a moderate one.

pricetaxes

Finally, at footnote 19, Chetty et al. also point out that they do not account for in-kind transfers prior to 1967 (there were some).  And, on page 13, they point out that “one may be concerned that levels of absolute mobility for recent cohorts may still be understated because of increases in fringe benefits, nonmarket goods, or under-reporting of income in the CPS”. Add in all these little extra problems to the family size, the transfers and the inflation correction and I am not sure how big the drop from 1940 to the end of the studied period is. Finally, I would also add that an understudied point in economic history is what the distribution of in-kind payments according to income was. From studying the British industrial revolution, I have generally to see that it is the poorest workers who receive in-kind payments (which are not measured) and the richest receive much fewer of those in proportion of their incomes. One of the few to note that distributional was the hardcore left-leaning scholar Gabriel Kolko who mentioned this issue in Dissent back in the 1950s.  If Kolko is correct, then the income of “poor parents” in 1940 is underestimated. As a result, the bar over which the children of said parents must jump is set mildly too low. If that is the case, the odds for the 1940 birth cohort are overestimated.

Combine all of these things together and I am not sure that the drop is as dramatic as many are making it out to be. I would be very satisfied if Chetty et al. would publish all the corrections they did and do a sensitivity check with hypothetical regarding a sliding-scale of in-kind payments in 1940 according to income (10% of income for poorest to 0% for the richest). I would just like to see how much it matters.

In Cuba, not having a car might save your life

My two blog posts on the health statistics of Cuba have convinced me to try to assemble a research article on the topic of assessing health outcomes under Castro’s regime. My first blog post was that there is a trade-off (the core of the article) that Castro decided to make. He would use extreme coercive measures to reduce some forms of mortality in order to shore up support abroad. The cost of such institutions is limited economic growth and increased mortality from other causes (dying from waterborne diseases or poverty diseases rather than dying from measles).

When I thought of that, I was inspired by Werner Troesken’s Pox of Liberty on the American constitution and the disease environment of the country. I was mostly concerned by direct medical interventions. However, the extent of coercive measures used by Castro go well beyond simple medical care (or medical imposition). Price controls, rationing and import restrictions on many goods could also help improve life expectancy. Indeed, rationing salt at 10g (hypothetical number) per person per day is a good way to prevent dietary diseases that emerge as a complication from overconsumption of salt. That will, by definition, raise life expectancy.

And so will bans on importing cars.

There is an extensive literature on the role that car fatalities has on life expectancy. This paper in Demography (one of the top demographic journals) finds that male life expectancy in Brazil is lowered by 0.8 years by traffic deaths. And traffic has very little to do with the quality of health care services. Basically, the more you drive, the more chances you have of dying (duh!). But, people don’t care much because the benefits of driving outweigh the personal risks.

In Cuba, people don’t get to make that choice. As a result, the very few drivers on Cuban roads have few accidents. According to WHO data, the car fatality rate is 8.15 per 100,000. There is also only 55 cars per 1,000 persons in Cuba. The next closest country is Nicaragua at 93 cars per 1,000 and the top country is Uruguay at 584 cars per 1,000. When you compute reported (rather than WHO estimated) car fatalities per 1,000 cars (rather than persons), Cuba becomes the unsafest place to drive in Latin America (1.46 fatalities per 1,000 cars) after El Salvador (2.22 fatalities per 1000 cars but only 129 cars per 1000), Ecuador (1.78 fatalities per 1000 cars but only 109 cars per 1000) and Bolivia (1.53  fatalities per 1000 cars and only 113 cars per 1000).

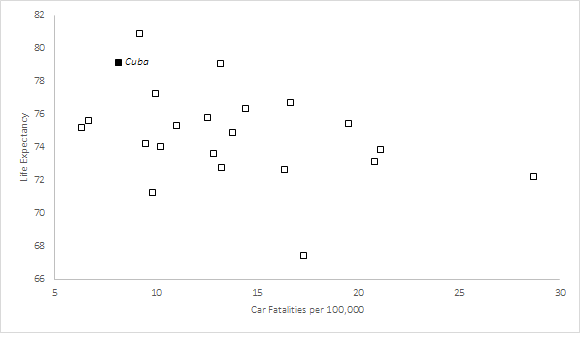
The graph below shows the relation between car fatalities per 100,000 inhabitants and life expectancy. Cuba is singled out as a black square. Low rate of car fatalities, higher life expectancy. Obviously, this is not a regression and so I am not trying to infer too much. However, it seems fair to say that Cuba’s life expectancy can easily be explained by the fact that Cubans face stiff prohibitions on the ability to drive. Those prohibitions give them a few extra years of life for sure, but would you really call that a ringing endorsement of the health outcomes under Castro’s regime? I don’t…

life-expectancy

Testing the High-Wage Economy (HWE) Hypothesis

Over the last week or so, I have been heavily involved in a twitterminar (yes, I am coining that portemanteau term to designate academic discussions on twitter – proof that some good can come out of social media) between myself, Judy Stephenson , Ben Schneider , Benjamin Guilbert, Mark Koyama, Pseudoerasmus,  Anton Howes (whose main flaw is that he is from King’s College London while I am from the LSE – nothing rational here), Alan Fernihough and  Lyman Stone. The topic? How suitable is the “high-wage economy” (HWE) explanation of the British industrial revolution (BIR).

Twitter debates are hard to follow and there is a need for summaries given the format of twitter. As a result, I am attempting such a summary here which is laced with my own comments regarding my skepticism and possible resolution venues.

An honest account of HWE

First of all, it is necessary to offer a proper enunciation of HWE’s role in explaining the industrial revolution as advanced by its main proponent, Robert Allen.  This is a necessary step because there is a literature attempting to use high-wages as an efficiency wage argument. A good example is Morris Altman’s Economic Growth and the High-Wage Economy  (see here too) Altman summarizes his “key message” as the idea that “improving the material well-being of workers, even prior to immediate increases in productivity can be expected to have positive effects on productivity through its impact on economic efficiency and technological change”. He also made the same argument with my native home province of Quebec relative to Ontario during the late 19th century. This is basically a multiple equilibria story. And its not exactly what Allen advances. Allen’s argument is that wages were high in England relative to energy. This factors price ratio stimulated the development of technologies and industries that spearheaded the BIR. This is basically a context-specific argument and not a “conventional” efficiency wage approach as that of Allen. There are similarities, but they are also considerable differences. Secondly, the HWE hypothesis is basically a meta-argument about the Industrial Revolution. It would be unfair to caricature it as an “overarching” explanation. Rather, the version of HWE advanced by Robert Allen (see his book here) is one where there are many factors at play but there is one – HWE – which had the strongest effects. Moreover, while it does not explain all, it was dependent on other factors that contributed independently.  The most common view is that this is mixed with Joel Mokyr’s supply of inventions story (which is what Nick Crafts has done). In the graph below, the “realistically multi-causal” explanation is how I see HWE. In Allen’s explanation, it holds the place that cause #1 does. According to other economists, HWE holds spot #2 or spot #3 and Mokyr’s explanations holds spot #1.
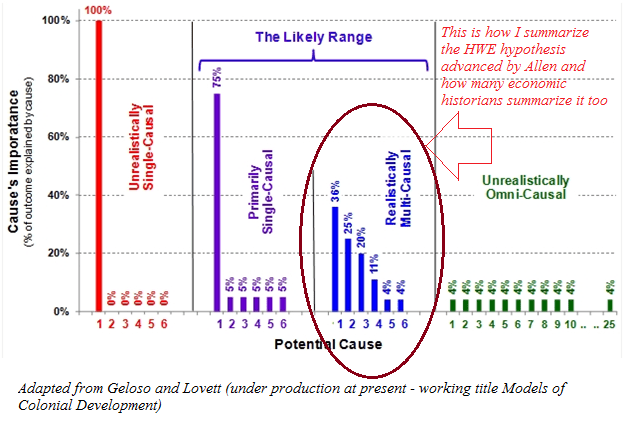
hwe

In pure theoretical terms (as an axiomatic statement), the Allen model is defensible. It is a logically consistent construct. It has some questionnable assumptions, but it has no self-contradictions. Basically, any criticism of HWE must question the validity of the theory based on empirical evidence (see my argument with Graham Brownlow here) regarding the necessary conditions. This is the hallmark of Allen’s work: logical consistency. His work cannot be simply brushed aside – it is well argued and there is supportive evidence. The logical construction of his argument requires a deep discussion and any criticism that will convince must encompass many factors.

Why not France? Or How to Test HWE

As a doubter of Allen’s theory (I am willing to be convinced, hence my categorization as doubter), the best way to phrase my criticism is to ask the mirror of his question. Rather than asking “Why was the Industrial Revolution British”, I ask “Why Wasn’t it French”. This is what Allen does in his work when he asks explicitly “Why not France?” (p.203 of his book). The answer proposed is that English wages were high enough to justify the adoption of labor-saving technologies. In France, they were not. This led to differing rates of technological adoptions, an example of which is the spinning jenny.

This argument hinges on some key conditions :

  1. Wages were higher in England than in France
  2. Unit labor costs were higher in England than in France (productivity-adjusted wages) (a point made by Kelly, Mokyr and Ó Gráda)
  3. Market size factors are not sufficiently important to overshadow the effects of lower wages in France (R&D costs over market size mean a low fixed cost relative to potential market size)
  4. The work year is equal in France as in England
  5. The cost of energy in France relative to labor is higher than in England
  6. Output remained constant while hours fell – a contention at odds with the Industrious Revolution which the same as saying that marginal productivity moves inversely with working hours

If most of these empirical statements hold, then the argument of Allen holds. I am pretty convinced by the evidence advanced by Allen (and E.A. Wrigley also) regarding the low relative of energy in England. Thus, I am pretty convinced that condition #5 holds. Moreover, given the increases in transport productivity within England (here and here), the limited barriers to internal trade (here), I would not be surprised that it was relatively easy to supply energy on the British market prior to 1800 (at least relative to France).

Condition #3 is harder to assess in terms of important. Market size, in a Smithian world, is not only about population (see scale effects literature). Market size is a function of transaction costs between individuals, a large share of which are determined by institutional arrangements. France has a much larger population than England so there could have been scale effects, but France also had more barriers to internal trade that could have limited market size. I will return to this below.

Condition #1,2,4 are basically empirical statements. They are also the main points of tactical assault on Allen’s theory.  I think condition #1 is the easiest to tackle. I am currently writing a piece derived from my dissertation showing that – at least with regards to Strasbourg – wages in France presented in Allen (his 2001 article) are heavily underestimated (by somewhere between 12% and 40% using winter workers in agriculture and as much as 70% using the average for laborers in agriculture). The work of Judy Stephenson, Jane Humphries and Jacob Weisdorf has also thrown the level and trend of British wages into doubts. Bringing French wages upwards and British wages downwards could damage the Allen story. However, this would not be a sufficient theory. Industrialization was generally concentrated geographically. If labor markets in one country are not sufficiently integrated and the industrializing area (lets say the “textile” area of Lancashire or the French Manchester of Mulhouse or the Caën region in Normandy) has uniquely different wages, then Allen’s theory can hold since what matters is the local wage rate relative to energy. Pseudoerasmus has made this point but I can’t find any mention of that very plausible defense in Allen’s work.

Condition #2 is the weakest point and given Robert Fogel’s work on net nutrition in France and England, I have no problem in assuming that French workers were less productive. However, the best evidence would be to extract piece rates in textile-producing regions of France and England. This would eliminate any issue with wages and measuring national productivity differences. Piece rates would perfectly capture productivity and thus the argument could be measured in a very straightforward manner.

Condition #4 is harder to assess and more research would be needed. However, it is the most crucial piece of evidence required to settle the issue once and for all. Pre-industrial labor markets are not exactly like those of modern days. Search costs were high which works in a manner described (with reservations) by Alan Manning in his work on monopsony but with much more frictions. In such a market, workers may be willing to trade in lower wage rates for longer work years. In fact, its like a job security argument. Would you prefer 313 days of work guaranteed at 1 shilling per day or a 10% chance of working 313 days for 1.5 shillings a day (I’ve skewed the hypothetical numbers to make my point)? Now, if there are differences in the structure of labor markets in France and England during the 18th and 19th centuries, there might be differences in the extent of that trade-off in both countries. Different average discount on wages would affect production methods. If French workers were prone to sacrifice more on wages for steady employment, it may render one production method more profitable than in England. Assessing the extent of the discount of annual to daily wages on both markets would identify this issue.

The remaining condition (condition #6) is, in my opinion, dead on arrival. Allen’s model, in the case of the spinning jenny, assumed that labor hours moved in an opposite direction as marginal productivity. This is in direct opposition to the well-established industrious revolution. This point has been made convincingly by Gragnolati, Moschella and Pugliese in the Journal of Economic History. 

In terms of research strategy, getting piece rates, proper wage estimates and proper labor supplied estimates for England and France would resolve most of the issue. Condition #3 could then be assessed as a plausibility residual.  Once we know about working hours, actual productivity and real wages differences, we can test how big the difference in market size has to be to deter adoption in France. If the difference seems implausible (given the empirical limitations of measuring effective market size in the 18th century in both markets), then we can assess the presence of this condition.

My counter-argument : social networks and diffusion

For the sake of argument, let’s imagine that all of the evidence favors the skeptics, then what? It is all well and good to tear down the edifice but we are left with a gaping hole and everything starts again. It would be great to propose a new edifice as the old one is being questioned. This is where I am very much enclined towards the rarely discussed work of Leonard Dudley (Mothers of Innovation). Simply put, Dudley’s argument is that social networks allowed the diffusion of technologies within England that fostered economic growth. He has an analogy from physics which gets the point across nicely. Matter has three states : solid, gas, liquid. Solids are stable but resist to change. Gas, matter are much more random and change frequently by interacting with other gas, but any relation is ephemeral. Liquids permit change through interaction, but they are stable enough to allow interactions to persist for some time. Technological innovation is like a liquid. It can “mix” things together in a somewhat stable form.

This is where one of my argument takes life. In a small article for Economic Affairs, I argued (expanding on Dudley) that social networks allowed this mixing (I am also expanding that argument in a working paper with Adam Martin of Texas Tech University). However, I added a twist to that argument which I imported from the work of Israel Kirzner (one of the most cited books in economics, but not by cliometricians – more than 7000 citations on google scholar). Economic growth, in Kirzner’s mind,  is the result of entrepreneurs discovering errors and arbitrage possibilities. In a way, growth is a process of discovering correcting errors. An analogy to make this point is that entrepreneurs look for profits where the light is while also trying to move the light to see where it is dark. What Kirzner dubs as “alertness” is in fact nothing else than repeated and frequent interactions. The more your interact with others, the easier it becomes for ideas to have sex. Thus, what matters is how easy it is for social networks to appear and generate cheap information and interactions for members without the problem of free riders. This is where the work of Anton Howes becomes very valuable. Howes, in his PhD thesis supervised by Adam Martin who is my co-author on the aforementioned project (summary here), showed that most innovators went in frequent with one another and they inspired themselves from each other. This is alertness ignited!

If properly harnessed, the combination of the works of Howes and Dudley (and also James Dowey who was a PhD student at the LSE with me and whose work is *Trump voice* Amazing) can stand as a substitute to Allen’s HWE if invalidated.

Conclusion

If I came across as bashing on Allen in this post, then you have misread me. I admire Allen for the clarity of his reasoning and his expositions (given that I am working on a funded project to recalculate tax-based measures in the US used by Piketty to account for tax avoidance, I can appreciate the clarity in which Allen expresses himself). I also admire him for wanting to “Go big or go home” (which you can see in all his other work, especially on enclosures). My point is that I am willing to be convinced of HWE, but I find that the evidence leans towards rejecting it. But that is very limited and flawed evidence and asserting this clearly is hard (as some of the flaws can go his way). Nitpicking Allen’s HWE is a necessary step for clearly determining the cause of BIR. It is not sufficient as a logically consistent substitute must be presented to the research community. In any case, there is my long summary of the twitteminar (officially trademarked now!)

P.S. Inspired by Peter Bent’s INET research webinar on institutional responses to financial crises, I am trying to organize a similar (low-cost) venue for presenting research papers on HWE assessment. More news on this later.
The Uniqueness of Italian Internal Divergence

A few weeks ago, I got engaged in a twitter debate with Garett Jones, Pseudoerasmus and Anna Missiaia (see her great work here) about institutions in Italy. During the course of that discussion, I was made aware that I held a false belief. Namely, the belief that since the late 19th century, there had only been a minor divergence within Italy. In reality, there has been considerable divergence within the country since the late 19th century.

In the wake of the Italian referendum, it is worth examining how big is this divergence. Below is a map of regional GDP per capita taken from Europa.ec.  The southern regions of Italy have GDP per capita below 75% of the European average while some of the northern regions have GDP per capita above 125% of the European average. The IStat database suggest similar levels of divergence across regions in Italy.

Gross_domestic_product_(GDP)_per_inhabitant_in_purchasing_power_standard_(PPS)_in_relation_to_the_EU-28_average,_by_NUTS_2_regions,_2014_(¹)_(%_of_the_EU-28_average,_EU-28_=_100)_RYB2016.png

So, how much divergence was there – say a little a more than one hundred years ago? Well, according to the great work of Felice (see here in the Economic History Review and here), there were more similarities back in the 19th century than there are today. Take the Liguria which – in 1891 – had per capita value added of 44% above national average. Take also Campania which was 3% below the national average. Today, the IStat data places Liguria 9% above national average but the region of Campania is 37% below the national average. Overall, regardless of how you present the data , divergence has increase. Just expressed at coefficient of variations, there has been an increase. In 1891, the coefficient of variation stood at 22.95% while it stood at 28.95% in 2013.

italiangdp

This makes Italy into an oddity. My own work shows that in Canada, since the 19th century, there has been considerable convergence (see article in Economics Bulletin). The same happened in the United States (see this paper by Michener and McLean), in England (here and here) and in Sweden (here). Among western countries, increased internal divergence is rare and Italy is the prime case example. And this is a strong indictment. Either Italy as a whole shares the same steady-state status and something is preventing upwards convergence from the South or Italy has two different economies with two different steady-states. In both cases, the implications are depressing.

Has there been any improvements in the relative economic conditions of American blacks?

A few years ago, I was teaching at HEC Montréal and I explained that putting people in prison – by statistical definition – did reduce unemployment. My students were shocked that I would say that. I told them that it was important to know definitions like that because you can then analyze the BS that politicians and pundits can spew.

And the case of Black-Americans is the best example, especially with regards to the wage gap. In recent years, I have seen pundits (left and right) use the slightly increasing ratio of black-to-white wages as a tool to promote their favored political narrative (i.e. the BS that I am referring to).

But, at the same time, the incarceration rates of Blacks has increased dramatically. Tell me, do you think that the socio-economic features of blacks in jail are distributed the same way as the socio-economic features of blacks not in jail? Of course not, criminals tend to be clustered disproportionately at the bottom of the income ladder. However, when its time to collect the wage statistics for blacks and whites, you are basically considering only the wages of blacks not in jail (i.e. blacks who are in the top centiles of the wage distribution). So, you’re basically committing a sin of statistical composition.

Some bloggers have caught on to that – the wage ratio is going up at the same pace as the incarceration rate for blacks. But they caught on after the work of scholars like Becky Pettit and Bruce Western came along (here and here and see graph below that illustrates the effect of correcting for incarceration on the employment rate of blacks).

pettit

When I look at this evidence, I understand why some people are pissed off at the conditions of Black Americans. It throws in doubt the contention that there has been racial convergence in America. At the same time, I wonder if the lack of recognition given to this statistical issue is a form of cognitive dissonance. If you claim that the convergence is mostly an artifice of composition fallacies, then what does it say about the policies of the last 30-40 years?

When Black Unemployment Rates Were Equal to White Unemployment Rates…

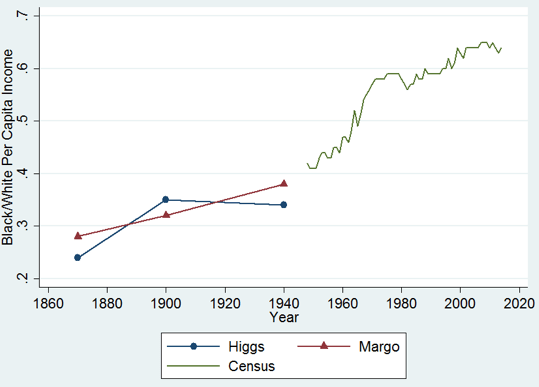
In a twitter-debate with Tariq Nasheed, I pointed out that the wages rates did converge between the 1940s and 1990s. Recently, Robert Margo of the University of Chicago extended this to per capita incomes since 1870. It is fascinating to see that there was convergence between 1870 and 1940 in spite of Jim Crow laws (it tells you how much more blacks could have achieved had the laws not existed – see notably the work of Bob Higgs on this).

income-convergece

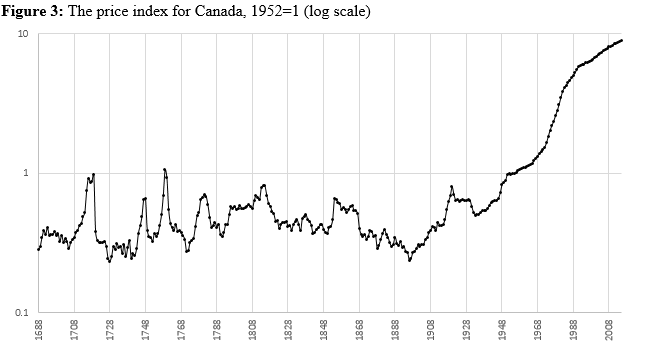
Each time I see this evidence, I am bemused. You see, I often debate colleagues on particular features of social policy in order to assess policy reforms or the effects of past reforms. But, its always good to take a step back and look at the long-view of history. It puts things in perspective. The Margo graph does just that. It tells me the story of what could have been. And just for the sake of remembering properly (infer whatever conclusions you like), it is worth showing racial differences in unemployment rates since 1890. What strikes me is how similar the rates are until the 1950s. What happened at that point? When you ask yourself this question, you’re forced to put everything in perspective. And it becomes harder to have “generic” answers in the lazy-form of “its racism”. Why would racism explain the difference after 1950, but not before?
whites

Maybe, just maybe, people like Tariq Nasheed should stop proving that H.L. Mencken was right in saying that “for every complex problem, there is an answer that is simple, clear and plainly wrong”.


Planned obsolescence (in parts)

In response to my post on planned obsolescence, some have pointed out that a good is composed of many different inputs. If there are differences in the quality of the different parts of a good, then it might be rational to reduce its lifespan.

That is a important possibility which I should have considered. Imagine that good 1 is composed of parts A, B and C whose lifespan are 1, 2 and 3 years. The manufacturer of good 1 will converge one the lifespan which, in relative terms, will maximize his profits. If it costs more to bring part A to the lifespan of part C than it is to bring part C to the lifespan of part A, then a lower total lifespan would be appreciable.  That decision reduces the lifespan and the marginal cost which means that a greater quantity of goods can be consumed than if we “over-engineer” by bringing A to the level of C. This point was brought to my attention by Michael Makovi, a graduate student at Texas Tech University’s department of agricultural economics. In his words:

The corporate executive types told the engineers: If one part of the product can last X years but the other part of the machine can last Y years, then under-engineer the longer-lasting parts so that the whole product uniformly lasts the lowest-common-denominator of time, so that when the product fails, the customer didn’t waste money on over-engineering other parts of the product to last longer (…) engineers balked because it seemed immoral, but the executives assured them that it was in the customer’s own best interest. For example (…) if one part of your refrigerator lasts 10 years but another part lasts 20 years, and if the 10 year part cannot be replaced, so you have to replace the whole refrigerator at once, then over-engineering the other part to last 20 years is a waste of money.

What if fake news was merely an attempt at political entrepreneurship?

Fake news! The new plague that besets mankind! That is largely the new name given to what 19th century folks would have called “yellow journalism“.

Yellow journalism was sensationalist to the point of distorting the news in order to carry a very emotional message. Generally embedded in that message was a political narrative supporting progressive reforms (not all yellow journalists were progressive but it seems that most were).

The aim of many progressives was to design a new society, to reform the old society by getting rid of old institutions. In many cases, economic historians have documented that these reforms (like with prohibition, workers compensation, antitrust) ended up serving very narrow interest groups who either allied themselves with reforming zealots (as in bootleggers helping baptists pass Sunday sales bans), gained through the restriction of competition or gained at the expense of future workers and minorities. But it is not as if the “previous” order was paradise. The postbellum era prior to the progressive era was highly protectionist, used public funds to bailout poorly performing railways and solicited the federal army to deal with natives rather than peacefully deal with them.  Basically, both eras had their political entrepreneurs who found their way in the political process to obtain favors.

Progressives who indulged in yellow journalism merely wanted to replace one set of political entrepreneurs with another. Just like the Alt-Right, from which emanates most of the fake news. In a way, both are exactly the same. Many members of the Alt-Right are not interested in restraining government abuses, they’re in favor of redirecting government indulgences towards them (Trump did promise less immigration with paid maternity leaves and no reduction in social transfers). Some are well-meaning like the baptists of lore. But there are still bootleggers (example: Steven Mnuchin from Goldman Sachs) who co-opt the process in order to continue indulging in rent-seeking just as they did before.

Are we about to swap one bad set of institutions for another? Given that all I see is the same type of political entrepreneurs (after all, Bannon from the flagship of the fake news alt-right outlet Breitbart is now a member of the government) as those we saw during the progressive era, I am inclined to respond “yes”.

On Cuba’s Fake Stats

On Monday, my piece on the use violence for public health purposes in Cuba (reducing infectious diseases through coercion at the expense of economic growth which in turn increases deaths from preventable diseases related to living standards) assumed that the statistics were correct.

They are not! How much so? A lot! 

As I mentioned on Monday, Cuban doctors face penalties for not meeting their “infant mortality” targets. As a result, they use extreme measures ranging from abortion against the mother’s will to sterilization and isolation.  They also have an incentive to lie…(pretty obvious right?)

How can they lie? By re-categorizing early neonatal (from birth to 7th day) or neonatal deaths (up to 28th day) as late fetal deaths. Early neonatal deaths and late fetal deaths are basically grouped together at “perinatal” deaths since they share the same factors. Normally, health statistics suggest that late fetal deaths and early neonatal deaths should be heavily correlated (the graph below makes everything clearer).  However late fetal deaths do not enter inside the infant mortality rates while the early neonatal deaths do enter that often-cited rate (see graph below).

Death Structures.png

Normally, the ratio of late fetal deaths to early neonatal deaths should be more or less constant across space. In the PERISTAT data (the one that best divides those deaths), most countries have a ratio of late fetal to early neonatal deaths ranging from 1.04 to 3.03. Cuba has a ratio of more than 6. This is pretty much a clear of data manipulation.

In a recent article published in Cuban Studies, Roberto Gonzales makes adjustments to create a range where the ratio would be in line with that of other countries. If it were, the infant mortality of Cuba would be between 7.45 and 11.16 per 1,000 births rather than the 5.79 per 1,000 reported by the regime – as much as 92% higher. As a result, Cuba moves from having an average infant mortality rate in the PERISTAT data to having the worst average infant mortality in that dataset – above that of most European and North American countries.

So not only is my comment from Monday very much valid, the “upside” (for a lack of a better term) I mentioned is largely overblown because doctors and politicians have an incentive to fake the numbers.

Is planned obsolescence a good thing?

There is this recurring argument that goods don’t last as long today as they did fifty years ago. My father berated me a few months ago about my economics by saying that back in his time, goods lasted longer. I questioned his data (there are signs that goods last as long as they did twenty or thirty years ago). This new ATTN video on Repair Cafes would have caused my father to rejoice greatly. However, I am going to ask a question here and go a step further: is planned obsolescence the symptom of a good thing?

Here is my argument (feel free to throw rocks after).

Improving the lifespan of a good requires a greater level of inputs which increases the marginal costs of the good. Producing a higher-quality good basically shifts the supply curve leftwards. Basically, we pay a little more for something that lasts longer. However, if we are living in a world of rapid technological innovation, what is the point of expending more resources on a good with a twenty-year lifespan but which will be obsolete two years?

Take my previous iPhone – it lasted three years before it simply decided to not work. In the three years between my old phone and my new phone, there was a rapid change in quality: more memory, better camera, faster processing, better sound. Imagine that Apple had invested billions to increase the life of my iPhone from three to nine years. Would I have bought that phone? In all honesty, it would depend on the price increase but the answer would have been closer to “no” than to “yes”. So in a way, Apple reaches a marginal consumer like me by lowering the price and turns me into a technology adopter. However, let’s imagine this from Apple’s perspective. Its in a race for its life against competitors who keep inventing new widgets and features that change the manner in which we consume. So, its choice is the following:

A: Increase lifespan, higher marginal costs and a leftward shift of supply that causes slightly higher prices and less demand. These resources cannot be expended on R&D and innovation
B: Shorten lifespan, lower marginal costs, lower prices, more goods consumed; more resources on R&D and innovation.

If everyone is inventing rapidly, then B is the dominant strategy. If innovation is zero, A is the dominant strategy. Basically, in a Schumpeterian world like I am describing, the short lifespan of goods is a symptom of great innovations and better days to come.

What do you think?


Castro: Coercing Cubans into Health

On Black Friday, one of the few remaining tyrants in the world passed away (see the great spread of democracy in the world since 1988). Fidel Castro is a man that I will not mourn nor will I celebrate his passing. What I mourn are the lives he destroyed, the men and women he impoverished, the dreams he crushed and the suffering he inflicted on the innocents. When I state this feeling to others, I am told that he improved life expectancy in Cuba and reduced infant mortality.

To which I reply: why are you proving my point?

The reality that few people understand is that even poor countries can easily reduce mortality with the use of coercive measures available to a centralized dictatorship. There are many diseases (like smallpox) that spread because individuals have a hard time coordinating their actions and cannot prevent free riders (if 90% of people get vaccinated, the 10% remaining gets the protection without having to endure the cost). This type of disease is very easy to fight for a state: force people to get vaccinated.

However, there is a tradeoff to this. The type of institutions that can use violence so cheaply and so efficiently is also the type of institutions that has a hard time creating economic growth and development. Countries with “unfree” institutions are generally poor and grow slowly. Thus, these countries can fight some diseases efficiently (like smallpox and yellow fever), but not other diseases that are related to individual well-being (i.e. poverty diseases). This implies that you get unfree institutions and low rates of epidemics but high levels of poverty and high rates of mortality from tuberculosis, diarrhea, typhoid fever, heart diseases, nephritis.

This argument is basically the argument of Werner Troesken in his great book, The Pox of LibertyHow does it apply to Cuba?

First of all, by 1959, Cuba was already in the top of development indexes for the Americas – a very rich and healthy place by Latin American standards. A large part of the high levels of health indicators were actually the result of coercion. Cuba actually got its very low levels of mortality as a result of the Spanish-American war when the island was occupied by American invaders. They fought yellow fever and other diseases with impressive levels of violence. As Troesken mentions, the rate of mortality fell dramatically in Cuba as a result of this coercion.

Upon taking power in 1959, Castro did exactly the same thing as the Americans. From a public choice perspective, he needed something to shore up support.  His policies were not geared towards wealth creation, but they were geared towards the efficient use of violence. As Linda Whiteford and Laurence Branch point out, personal choices are heavily controlled in Cuba in order to achieve these outcomes. Heavy restrictions exist on what Cubans can eat, drink and do. When pregnancies are deemed risky, doctors have to coerce women to undergo abortion in spite of their wishes. Some women are incarcerated in the Casas de Maternidad in spite of their wishes. On top of this, forced sterilization in some cases are an actually documented policy tool.   These restrictions do reduce mortality, but they feel like a heavy price for the people. On the other hand, the Castrist regime did get something to brag about and it got international support.

However, when you look at the other side of the tradeoff, you see that death rates from “poverty diseases” don’t seem to have dropped (while they did elsewhere in Latin America).  In fact, there are signs that the aggregate infant mortality rates of many other Latin Americans countries collapsed toward the low-levels seen in Cuba when Castro took over in 1959  (here too). Moreover, the crude mortality rate is increasing while infant mortality is decreasing (which is a strong indictment about how much shorter adult lives are in Cuba).

So, yes, Cuba has been very good at reducing mortality from communicable diseases and choice-based outcomes (like how to give birth) that can be reduced by the extreme use of violence. The cost of that use of violence is a low level of development that allows preventable diseases and poverty diseases to remain rampant. Hardly something to celebrate!

Finally, it is also worth pointing two other facts. First of all, economic growth in Cuba has taken place since the 1990s (after decades of stagnation in absolute terms and decline in relative terms). This is the result of the very modest forms of liberalization that were adopted by the Cuban dictatorship as a result of the end of Soviet subsidies. Thus, what little improvements we can see can be largely attributed to those. Secondly, the level of living standards prior to 1990 was largely boosted by the Soviet subsidies but we can doubt how much of it actually went into the hands of the population given that Fidel Castro is worth 900$ million according to Forbes. Thus, yes, Cubans did remain dirt poor during Castro’s reign up to 1990. Thirdly, doctors are penalized for “not meeting quotas” and thus they do lie about the statistics. One thing that is done by the regime is to categorize “infant deaths” as “late fetal deaths” – its basically extending the definition in order to conceal a poorer performance.

Overall, there is nothing to celebrate about Castro’s dictatorship. What some do celebrate is something that was a deliberate political action on the part of Castro to gain support and it came at the cost of personal freedom and higher deaths from preventable diseases and poverty diseases.

H/T : The great (and French-speaking – which is a plus in my eyes because there is so much unexploited content in French) Pseudoerasmus gave me many ideas – see his great discussion here.

England circa 1700: low-wage or high-wage

A few months ago, I discussed the work of my friend (and fellow LSE graduate) Judy Stephenson on the “high-wage economy” of England during the 18th century. The high-wage argument basically states that high wages relative to capital incite management to find new techniques of production and that, as a result, the industrial revolution could be initiated. Its a crude summary (I am not doing it justice here), but its roughly accurate.

In her work, Judy basically indicated that the “high-wage economy” observed in the data was a statistical artifact. The wage rates historians have been using are not wage rates, they’re contract rates that include an overhead for contractors who hired the works. The wage rates were below the contract rates in an amplitude sufficient to damage the high-wage narrative.

A few days ago, Jane Humphries (who has been a great inspiration for Judy and whose work I have been discretely following for years) and Jacob Weisdorf came out with a new working paper on the issue that have reinforced my skepticism of the wages regarding England. A crude summary of Humphries and Weisdorf’s paper goes as such: preindustrial labor markets had search costs, workers were willing to sacrifice on the daily wage rate (lower w) in order to obtain steady employment (greater L) and thus the proper variable of interest is the wage paid on annual contracts.

While their results do not affect England’s relative position (it only affects the trend of living standards in England), it shows that there are flaws in the data. These flaws should give us pause before proposing a strong theory like the “high-wage economy” argument. Taken together, the work of Stephenson (whom I am told is officially forthcoming), Humphries and Weisdorf show the importance of doing data work as the new data may overturn some key pieces of research (maybe, I am not sure, there is some stuff worth testing).

Josh Barro and the Gold Standard

A few days ago, when it was announced that former Cato Institute president John Allison was under consideration for treasury secretary, Josh Barro of Business Insider dismissed the man as a “nutcase”. Why? Because Allison believes that the Federal Deposit Insurance Corporation (FDIC) generates a moral hazard that contributes to financial crises (a statement I agree with).

This slur irked one of the economists at Cato, George Selgin, who took to twitter to challenge Barro. In the exchange, at one point, Barro indicated that the desire of libertarians to return to the gold standard confirms the “nuttiness” of libertarians and the people at Cato.

And here, Barro allows me to make a comment on the gold standard. The sympathy towards the gold standard is not sympathy towards gold per se, but rather sympathy for reducing the capacity of governments to exercise discretion. Basically, each time you hear some academic economist mention the gold standard, what that economist means is rules-based monetary policy.

The gold standard era (1875-1914) was not an image of perfect monetary policy. It is not a lost paradise that we ought to strive to. However, the implicit rules imposed by the system did favor more stability that would have been the case with discretion during that era. In fact, the era of central banking with the Federal Reserve has not been that great relative to the gold standard era (and in the world of central banks, the Fed is pretty good). A lot of the scorn that the gold standard era has received had to do with regulatory policy towards banks (notably regarding restrictions on branch banking which forced more volatility) or with the role of changes in international demand for assets (see here). Thus, in spite of its many flaws, the gold standard was not that bad (but it was not* gold per se that was helpful – it was the shunning of discretion by governments).

To be sure, I do not favor a return to a gold standard era. What I do like, and what I think John Allison likes as well, is the return to rules-based monetary policy. Josh Barro should have been intellectually generous and understand this key distinction. By not making that distinction, of which he must be aware given his background, he debased the debate over monetary policy.