Rules for Rulers

Watch to the end for details about the book (by Bruce Bueno de Mesquita and Alastair Smith) this video is based on.

  1. I think readers of NoL will enjoy this nicely condensed public-choice-y analysis of the constraints involved in operating (and thus changing) a government.
  2. The audiobook is available on Overdrive, so you can borrow it from your library. I’m just started listening to it and I’m enjoying it immensely.
  3. I suddenly found myself as the benevolent dictator of some country. My long-term objective is to shape my society into a libertarian utopia. Here’s my plan to deal with the constraints discussed in the video: all of my advisors are required to play devil’s advocate when I propose some change. Yes-men will be summarily executed. Assuming I stay benevolent but also ruthless, does my devil’s advocate scheme work out? Please discuss in the comments. Anyone who doesn’t earnestly try to poke holes in my idea will be sent to the work camps.

Sound Money Project Relaunch

The Sound Money Project has relaunched this November at the American Institute for Economic Research (AIER) under the direction of William J. Luther.

Other than Luther and myself, you’ll see regular posts by Scott Burns, James Caton, Alexander W. Salter, and Brian C. Albrecht.

Digging Deeper into Populism: A Short Reply to Derril Watson

Derril Watson offer some critical remarks on my short post about populism in Latin America. In short, Watson is arguing that (1) I’m stating something obvious (populism diminishes economic freedom) and (2) that I’m wrong when I say that populism fails to produce economic growth.

Seems I haven’t been quite clear, because I state none of the above. The intention of my post is not to show that populism decreases economic freedom, I think this is uncontroversial. The point of the post is to show, with a very simple calculation, how fast economic freedom is reduced. I might be wrong, but I have the impression that most individuals do not realize how fast they can loose their economic liberties under this type of government. This is the message carried in the title of the post “How fast does populism destroy economic freedom in Latin America?” rather than “Does populism destroy economic freedom in Latin America?”

With respect to the second point, my claim is not that under populism there is no growth of GDP, my claim is that “populist governments failed to increase GDP per capita consistently faster than the region.” My original post is just a small bite of a paper that is still work in progress and I’ll share in due time. I wasn’t expecting this claim to be controversial. Still, the figure below shows the ratio of GDP per capita (PPP) of each of he countries I observe with respect to Latin America. All countries are centered in year 0 as the first year of populism as defined in my original post. That’s the first dot in the graph. The second dot shows either the last data available or the end of populism. None of these countries show a consistent higher growth rate than the rest of the region.

Populism - Fig 1

It seems to me that Watson is confusing growth with recovery. The fact that economic growth produces a growth in GDP does not mean that a growth in GDP is due to economic growth. The recovery mentioned by Watson in Argentina happens after the largest crisis in the history of the country and the largest default worldwide at the time. As I mentioned in my post, Argentina hits stagflation in 2007. This suggests to me a rapid recovery with no significant growth and built upon an unsustainable policy (for instance, Argentina fails to improve its relative income with respect to the region, it rather stagnates in 2007 and starts to fall a few years after.) I can show a large increase in my personal GDP as measured by consumption by depleting my savings (consuming my capital stock at the country level). I wouldn’t call that personal economic growth. The Kirchner government, for instance, failed to reduce poverty below the levels seen in the 1990s. It does, of course, if that is compared with the poverty levels around the years of the crisis (which is what Watson’s table is doing.) It should also be kept in mind that official poverty measures in Argentine were hampered by the government.

There’s still another important issue regarding GDP measures of Argentina. As it became well known, GDP series were hampered by the government (also inflation and poverty rates were hampered.) By 2014 official GDP values were overestimating the size of the economy by 24%. Another sign is the evolution of real wages in Argentina, which hits a ceiling again in 2007 with a level similar to the one at the end of 2001 (just before the crisis). In 2008, 2009, and 2010 real wages decline.

As a final comment, I’m not sure to what comment of mine Watson refers to. I don’t see a comment entry of mine in my original post, nor I remember doing so. In any case, I don’t get into the definition of populism precisely for how difficult that task can be. The problem of defying populism is one of the areas covered in my yet unfinished paper.

Digging Deeper into Populism

TL;DR summary: The one thing most populist governments studied had in common was a declining protection for property rights. Focus there next time.

Nicolás Cachanosky explained that populism in five Latin American countries had led to a rapid deterioration in their economic freedom, intimating that this also led to a relative drop in living standards compared to other South American countries. Given that the two primary economic strategies of populism are control and spend (Dornbusch and Edwards 1991 quoting Carbonetto et al. 1987), it would be shocking if a populist government did not reduce economic freedom. That’s the idea! However, there is more we could learn about how populism reduces economic freedom by doing a little more to identify exactly what it was that populist governments did. First, I think it’s useful to go a little further back, to compare how trends were looking before* populism (say by 1991) to how those trends changed with the election of a populist government. Second, I’m going to take a more careful look at how and why economic freedom decreased.

It is funny to me that when Cachanosky’s response to his first commenter is to ask for a definition and a measure before being willing to debate a correction; that suggests he really ought to have been more careful to define populism in his post. In fairness, that’s a tall order*: much of the literature on populism has been trying to define it and there is still no consensus as far as I can tell. Are we focusing primarily on increasing statism, whether it is called populism or progressivism or socialism or cronyism? Or is there something special about the populist brand of statism that we should be looking out for? To the extent populism is a “power to the people” movement, Libertarianism itself could try to appropriate the populist brand and claim they are taking power back from the government for the people! I don’t think this is what Cachanosky has in mind. :). I tend to think that he is focused mostly on statism and for the purposes of his post, it doesn’t matter whether it’s populism or socialism that caused it, so please assume when I say “populism” hereafter, I mean increased state control over the economy.

Even given that, populism/statism exists on a continuum. There is a marked difference between a determined populist government that nationalizes wide swathes of an economy rapidly in order to redistribute riches to the common people and someone in an unnamed developed country who uses populist rhetoric to get elected and keep his base happy only to turn around once in office and enact largely pro-business deregulations and strengthen conservative social mores.

Because of this, it’s important to make distinctions between the 5 countries in question (Argentina, Bolivia, Brazil, Ecuador, and Venezuela). To demonstrate that, let me focus on Argentina and Brazil. Mueller and Mueller (2012) contrast Brazil and Argentina’s responses to the global food price crisis in 2006-08, during this populist period in both countries. There have been very few checks and balances on executive power in Argentina, allowing the Kirchners to enact “opportunistic price controls and intrusive export bans, generating significant discontent and investment disincentives” (pg 3). In Brazil, the checks on the presidency to prevent a repeat of the late 80s/early 90s inflation led to “the surprising conversion of President Lula once in office in 2003, reneging the leftish policy agenda his party had defended for years in the opposition, only to continue the fiscally disciplined macroeconomic policies of his predecessor” (pg 5). These kinds of difference are very important to understand what happens and when and why.This table shows how Heritage’s Economic Freedom in the World survey ranked the five countries Cachanosky singles out as populist in 1995 when the survey started, the year when they elected a populist government, and 2015; I then add five other South American countries for comparison. 10 represents high economic freedom and 1 very low freedom. The astute reader will notice that I am using the raw scores rather than country rankings as Cachanosky does because I suspect it matters more for economic growth what happens within my country rather than thinking economic growth will collapse because a handful of other countries on other continents become more free while I stay put where I am: I will look worse by comparison, but not be worse.

Heritage Overall
1991 start 2015
Argentina (2003) 6.8 5.6 4.4
Bolivia (2006) 5.8 5.8 4.7
Brazil (2002) 5.1 6.2 5.6
Ecuador (2007) 5.7 5.5 4.9
Venezuela (1999) 6 5.6 3.4
Heritage overall
1995 2005 2015
Chile 7.1 7.8 7.9
Colombia 6.5 6 7.2
Paraguay 6.6 6.1 6.8
Peru 5.7 5.3 6.1
Uruguay 6.3 6.7 6.9

To delve into the Argentina/Brazil comparison again, the survey shows Argentina scoring markedly higher than Brazil in 1995. This situation had already reversed itself by 2003 and the start of populism. Since then Argentina has continued to fall rapidly while Brazil has turned reversed its progress. Delving deeper into those numbers, Argentina has become markedly less free in terms of almost every category Heritage measures (respect for property rights in 2001-2003, government integrity 2006-2008, tax burden, government spending since 2011, business freedom in 2002, and monetary, investment, and financial freedom in 2003), while Brazil’s primary sin was an increase in spending in 2006 and an increase in taxes to pay for it. That’s it. This shows a real deterioration in Argentinian freedom before populism, a trend only continued and exacerbated by the Kirchners, while Brazil has shown both improvement and decline, with a much different, constrained form of policy making. Argentinian populism and Brazilian are far from the same phenomenon.

In Bolivia and Ecuador, property rights fell in 2001 and investment freedom by 2005 before populism in either country and both slid down steadily after electing a populist government; both countries have improved in government integrity, taxes got worse in Ecuador in 2008 with spending increasing massively in 2010, and financial freedom worsened after populism started. Venezuela saw the largest decrease in respect for property rights right after electing Chavez and again in 2008. In contrast to other countries, Chavez initially reduced government spending and kept taxes roughly constant, with spending not increasing again until after 2008. Business and financial freedom declined steadily, investment freedom plummeted in 2004, and monetary freedom only declined in 2014.

We see then five rather different patterns, even though most of them saw the same sort of decline of 1.2-1.4 points. The key feature in all but Brazil is the decrease in respect for property rights shortly after the election of a populist government. Spending also tends to be higher in these five countries, though all happened during the global food price crisis and the US/EU financial crisis when spending also increased by many non-populist countries as well. Otherwise, there is very little in common among the five countries, with some embracing freer trade and others fleeing it, some cracking down on monetary and financial freedoms with others largely ignoring them. Our five ‘control’ countries saw an improvement in economic freedom from 2005-201, particularly in Colombia.  Colombia and Peru reduced their respect for property rights in 2002, but later repented; Paraguay has not held property rights in even modest esteem since 1998.

All of this suggests the place to look in future research is to the importance of declining respect for property rights among populist governments as a driver of economic freedom and economic growth.

And that brings us to the second of Cachanosky’s points – that this drop in economic freedom in those five countries led to shrinking economies compared to other economies in the region. First off, to be clear, all five of these populist economies experienced rapid economic growth during the time period in question, and this economic growth was much higher than the economic growth enjoyed in the decade before populism started. This would lead pro-populists to conclude that populism was actually quite good. Cachanosky admits that even though Argentina fell farther in the economic freedom rankings than its peers, its GDP/capita actually increased. He excuses this as being “largely explained as recovery after the 2001 crisis and by consuming capital stock, not as an expansion of potential output.” Unfortunately for his story, Argentina’s GDP/capita in terms of real USDollars not only surpassed its pre-crisis level (around $12300 in 1998), but rose to $17500 – a 42% increase during its populist period. (All numbers from www.gapminder.org are PPP$ inflation-adjusted.) In every single case he cites, GDP/capita rose while the headcount poverty rate fell dramatically.

However, compare their growth to the five control countries, and compare the time period before and after in each case:

GDP/cap (PPP$) Growth poverty (% below $3/day)
1991 start 2015 91-start start-15 1991 start 2014
Argentina (2003) 9330 10300 17500 10.40 69.90 3.9 19.1 4.3
Bolivia (2006) 3850 4370 6150 13.51 40.73 30.4 32.4 12.7
Brazil (2002) 10300 11600 15400 12.62 32.76 35.8 24.5 7.56
Ecuador (2007) 7690 7810 10800 1.56 38.28 36.5 32.9 10.2
Venezuela (1999) 16100 14200 15800 -11.80 11.27 N/A N/A N/A
GDP/cap (PPP$) Growth poverty (% below $3/day)
1991 2003 2015 91-start start-15 1991 2003 2014
Chile 9750 15500 22500 58.97 45.16 N/A N/A N/A
Colombia 7780 8680 12400 11.57 42.86 22.7 26.6 13.2
Paraguay 6040 5870 8040 -2.81 36.97 7.9 19.4 7
Peru 5290 6880 11500 30.06 67.15 33.9 27.2 9
Uruguay 10100 11500 19900 13.86 73.04 2.1 5.2 1.3

The 2003-2015 period was good across the board in South America, with most growing at least 30% more from 2003ish-2015 compared to 1991-2003. Similarly, poverty rates fell markedly from 2003-2014 in every country for which I have Gapminder data. So the claim is not that populism resulted in negative economic growth. The issue is that the average growth in the non-populist countries was around 1% per year higher than in the populist countries. Thus, to the populist-supporter who points to the high growth of Argentina et al as proof that populism works, the response is that growth was even higher in their non-populist neighbors and poverty is lower in them as well.

Now the unfortunate thing for drawing a clear causal interpretation from these correlations is that economic growth was also higher in the non-populist countries in the before period as well, perhaps due in part to having higher economic freedom to begin with. Growth in the freedom-preserving countries was slightly more than 1% per year higher, and that is driven predominantly by Chile. If Chile had had a more average 11-13% growth during that time period, we would be able to show more conclusively that the economic growth gap increased after populism. So, really, the claim that populism caused a lower economic growth in those countries doesn’t hold up very well – economic growth was lower in those countries before populism as well. It may well be that economic growth would have been higher in Argentina, Bolivia, Ecuador, and Venezuela had they maintained or improved their respect for property rights, but the raw data doesn’t tell us that without significantly more controls and doing some proper regressions.


* – One of the problems of this exercise is that to get “before” populism, you need to go back a hundred years or so. Ah well.

A quick rant on NY’s Excelsior Scholarship

Long Island Business News had a cover story last week: “Free for all?

And the answer is no.

NoL readers don’t need to be reminded that there ain’t no such thing as a free lunch. But I want to focus on the “for all” aspect. And the answer there is also no. This is a program that benefits the middle class and simply won’t be available for the poorest kids in the state.

There are a lot of different programs for paying for schooling costs, and I don’t want to get bogged down in specifics. So here’s (roughly) how this new program works: full time students whose family income is below (approximately) the 75th percentile get more money for school. That money goes away if they stop meeting those criteria.

This is not going to be helpful to poor students who don’t have to resources necessary to go to school full time. It sounds inclusive, but they might as well make the income requirement family income between the 60th and 75th percentile.

In the best case scenario, we might end up getting a positive return on this program (generating more tax revenues from more productive workers). But we still have to ask about what alternatives were possible.

Here are three problems with that outcome:

  1. If those kids were going to go to school anyways, then we’re just creating a common pool problem where costs and benefits aren’t compared by the relevant decision makers.
  2. If some of those kids weren’t going to go to school otherwise, then we’ve increased the pressure on poor kids to get a college degree without helping them out. And if we’re thinking of this like an investment, the returns would be higher on getting more poor kids to go through school.
  3. If this program doesn’t have a return on investment high enough to offset the costs, then that budget line has to compete with some other program (tax returns would be nice, or investment in infrastructure, or something else).

I don’t expect any legislation to solve the problem once and for all. But this program is more likely to make the underlying problems worse, at the expense of poor people, and with little net gain. Not only is this bad economics, it’s not even in line with the more honorable goals of progressives. It’s simply a way for politicians to buy votes with other people’s money.

Markets for Secrets?

In a world without intellectual property, would it be possible to buy and sell secrets? I suggest the answer is yes. In this post, I provide both a theoretical framework for such markets, as well as pointing to real life examples of such markets already existing.

Introduction

In a previous post, we talked about why information is the only public good. But of course, it’s possible to keep information private. Such private information is called a secret. Currently, entrepreneurs and inventors have two choices when they have what they believe is a profitable secret: they can either keep recipe, industrial process, or so on, a secret, and be protected by “trade secret” laws; or they can “publicize” their secret in exchange for a patent (which they can use to either issue injunctions against competitors or to extract royalties).

But there has been a lot of economics literature in recent years that challenges the status of intellectual property (IP). Most famously, there is Michele Boldrin and David K. Levine’s book Against Intellectual Monopoly, where they detail both an empirical and theoretical case against the economics of intellectual property. Furthermore, patent lawyer Stephan Kinsella’s book Against Intellectual Property gives a principled legal and ethical case against IP.

Continue reading

How fast does populism destroy economic freedom in Latin America?

The turn of the twentieth century has seen an increase in populist government in Latin America. That populism is no friend of free markets is well known. And even if their movement against free markets if fairly quick, it is common for individuals to loose track of how fast they are loosing their economic freedoms.

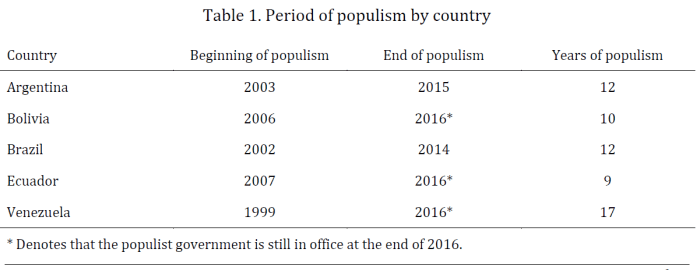
There are five cases of populist governments in Latin America that can work as benchmarks for the region. In particular, we can look at the behavior of governments in Argentina, Bolivia, Brazil, Ecuador, and Venezuela for the time frames depicted in the following table.

Table 1

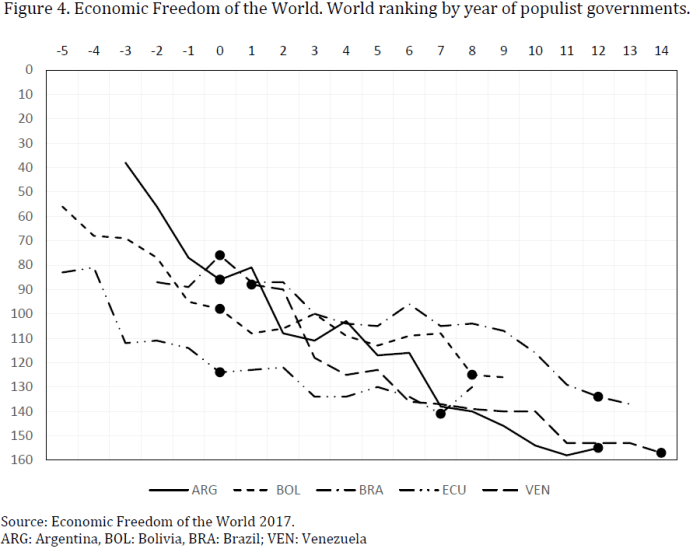
During this time period, populist governments failed to increase GDP per capita consistently faster than the region. The only exception is Argentina. But its fast increase in GDP is largely explained as recovery after the 2001 crisis and by consuming capital stock, not as an expansion of potential output. It is no accident that Argentina met stagflation in 2007. In the last three issues of the Economic Freedom of the World (Fraser Institute) Argentina ranks among the bottom 10 free economies in the world.

The following figure shows the fall in ranking of each country in the Economic Freedom of the World.

Figure 1

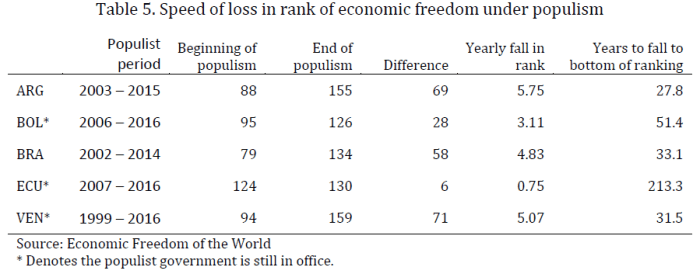
We can translate the information shown in the above into loss of ranking position per year of populist government. This is what is shown in the next table.

Table 2

This table offers a few readings:

  1. Argentina is the country that fall in the ranking of economic faster than its peers.
  2. Ecuador shows a very slow fall. This is due to two reasons: (1) Ecuador already starts from a low ranking position. (2) The last year of the index (2015) shows an improvement (without this improvement the fall is quite sharp as well.) Ecuador does not represent a case of “good populism.”

What this table is showing is that if an individual is born in any of these countries ranking 1st in economic freedom the same year a populist government takes office, then the same country will rank at the bottom of the world before he retires. In the case of Argentina, in 27.8 years the country will be at the bottom of the list, this means that by the time this individual starts to work, Argentina will already have a very repressed economy. By retiring time, this individual will have no experience of living and working in a free economy.

This numbers are not just descriptive of populism in Latin American countries. They also serve as a sort of warning for Europe and the United States, regions that have already seen some signs of populist behavior in their governments and political groups in the last few years. Populism can be emotionally attractive, but is very dangerous for our economic freedoms.

Physical Goods, Immaterial Goods, and Public Goods

Public goods in economics have been a contentious theoretical issue since Paul Samuelson introduced the concept in 1954. The main sources of contention are what real world things are public goods, and who should provide them. In this post I propose a new way of looking at goods that will shed light on why public goods have posed such a problem. In particular, I propose that there is an important distinction between physical goods and immaterial goods; that public goods can only be immaterial goods; and that this unique feature of public goods does not preclude the market to provide the “socially optimal level.

Introduction

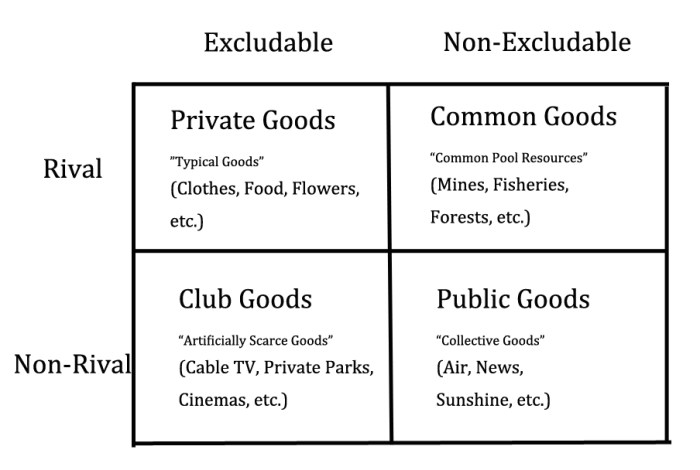
Economists define a public good as something that is “non-rival” (meaning that one person’s consumption does not affect another person’s), and “non-excludable” (meaning that one person cannot stop another person from consuming the good.) Public goods are often contrasted with private goods, which are rival and excludable.

The implications are that public goods cannot be provided by a free market, because no one would have to pay for such a good, and so there would be so incentive to produce it. Therefore, the argument goes, the government ought to provide public goods.

Features_of_goods

An example of a private good is an apple. Imagine a world with just you, me, and an apple. If I take a bite out of the apple, there is now less apple for you to consume. That means it’s rival. If I put the apple in a locker to which only I know the combination, then again you are prevented from consuming the apple. This makes it excludable.  Continue reading

North Korea at the North Sea?

Yesterday, both Houses of Dutch Parliament jointly opened the parliamentary year, which is always held on the third Tuesday in September, and is known as “Budget Day.” Normally, there is not much pomp and glory in the Low Lands, but on “Little Princes Day” (as the day is literally called), we go all-out: the King and Queen are driven in a horse-pulled carriage to the Hall of Knights, the oldest part of the parliamentary buildings (built around 1250), surrounded by military troops in full ceremonial dress. The King reads his speech (actually written by and under full political responsibility of the Prime Minister and cabinet) from a huge throne, announcing the government’s plans for the next year. Male ministers in morning coats, ladies in dresses and hats, with the powerful elites also assembled.

king and queen
King Willem-Alexander and Queen Maxima entering the Hall of Knights (source)

After the reading, the Royal couple make their way back to one of their palaces in the centre of The Hague, returning once to greet the masses from the balcony.

Meanwhile, the Minister of Finance officially presents the 2018 budget to the Lower House. The separate budgets of all departments are laws, which will have to pass both Houses before 31 December. This process is normally preceded by a two day debate on “the general state of the country,” but this year it is skipped because there is only a caretaker government in office. It awaits the finalization of negotiations for a new government, which started right after the elections on 15 March. Still no government is formed, although it is widely expected that a four-party coalition will be presented within a few weeks, consisting of small Christian left wingers, centre Christian Democrats, and two social liberal parties, D66, and Prime Minister Mark Rutte’s VVD.

Although much improved since the low point of the Great Recession, around 2011-2012, the public finances are still shocking from a classical liberal perspective. The income of the national government is 285 billion Euro (around 338.5 billion USD), which is 43% of GDP.

It consists mainly of several mandatory insurance premiums for collective arrangements (112.2 billion Euro), income tax (55.4 billion; the highest bracket of 51.5% tax applies to all personal income over 68.507 Euro), and VAT (52.8 billion). The rest are mainly specific taxes, related to companies, the environment, excises, dividends, et cetera. In 2011, the public share of GDP was still 47%, while in the 1980s it reached peaks of around 60%. Not exactly anywhere near an ideal liberal situation, no matter what liberal persuasion you are. Personally, I would argue that 25% should be the max for a decent set of state tasks, but I am sure that makes me some weird Northern European commie in some American libertarian eyes!

The situation is even more dire if we see where that money is spent. Health care (80.4 billion euro) and social security (79 billion) are always in competition as the largest spending departments. So that is 56% of the budget already and both increase annually, no matter the economic circumstances. The third post is public education (35.4 billion), followed by funds for provinces and municipalities (24.4 billion), foreign affairs and foreign aid (12), police and judiciary (10.3), defense (8.4), and infrastructure and environment (also 8.4), with the other departments taking parts of the rest. Despite a very rare expected budgetary surplus of 7.8 billion in 2018, the national debt is still 53.7% of GDP. Perhaps not bad in international comparison, still not good for any liberal.

These numbers are only part of the story, because there are also numerous local taxes, and the number of liberty-inhibiting regulations, from European, national, provincial and local origin are staggering. There is not one really free market, and there are hardly parts of individual life not regulated or influenced by the state. A comparison with North Korea is of course still far-fetched, yet socialism is alive and kicking on the North Sea shores.

In my view it is evidence of the remarkable power of capitalism that The Netherlands is still one of the richest countries on earth, a global top 15 economy (GDP per capita), with only 17 million inhabitants. No matter how hard you curb it, the capitalist system still delivers amazing results. Of course, the opportunity costs of the Dutch regulatory state are very high. In terms of personal liberty there are not many better places on the planet. Yet in other fields it is a different story. Economic freedom is a mess, which means that the material aspects of personal freedom are seriously restricted. Yet the worst is the mentality. Sadly, most Dutch have traveled the whole Hayekian Road to Serfdom, making a shift to classical liberalism highly unlikely.

On Financial Repression and ♀ Labor Supply after 1945

I just came back from the Economic History Association meeting in San Jose. There are so many papers that are worth mentioning (and many have got my brains going, see notably the work of Nuno Palma on monetary neutrality after the “discovery” of the New World). However, the thing that really had me thinking was the panel on which one could find Barry Eichengreen and Carmen Reinhart (who was an early echo of the keynote speech by Michael Bordo).

Here’s why : Barry Eichengreen seemed uncomfortable with the current state of affairs regarding financial regulation and pointed out that the after-war period was marked by rapid growth and strong financial regulation. Then, Reinhart and Bordo emphasized the role of financial repression in depressing growth – notably in the period praised by Eichengreen. I have priors that make more favorable to the Reinhart-Bordo position, but I can’t really deny the point made by Eichengreen.

This had me thinking for some time during and after the talks. Both positions are hard to contest but they are mutually exclusive. True, it is possible that growth was strong in spite of financial repression, but some can argue that by creating some stability, regulations actually improved growth in a way that surpassed the negative effects caused by repression. But, could there be another explanation?

Elsewhere on this blog, I have pointed out that I am not convinced that the Thirty Glorious were that “Glorious”.  In line with my Unified Growth Theory inclinations (don’t put me in that camp, but don’t exclude me either I am still cautious on this), I believe that we need to account for demographic factors that foil long-term comparisons. For example, in a paper on Canadian economic growth, I pointed out that growth from 1870 to today is much more modest once we divide output by household-size population rather than overall population (see blog post here that highlights my paper). Later, I pointed out the ideas behind another paper (which I am still writing and for which I need more data, notably to replicate something like this paper) regarding the role of the unmeasured household economy. There, I argued that the shift of women from the household to the market over-measures the actual increase in output. After all, to arrive at the net value of increased labor force participation, one must deduce the value of foregone outputs in the household – something we know little about in spite of the work of people like Valerie Ramey.

Both these factors suggest the need for corrections based on demographic changes to better reflect actual living standards. These demographic changes were most pronounced in the 1945-1975 era – that of the era of rapid growth highlighted by Eichengreen and of financial repression highlighted by Reinhart and Bordo. If these changes were most momentous in that period, it is fair to say that the measurement errors they induce are also largest in that era.

So, simply put, could it be that these were not years of rapid growth but of modest growth that were overestimated?  If so, that would put the clash of ideas between Bordo-Reinhart and Eichengreen in a different light – albeit one more favorable to the former than the latter.

But heh, this is me speculating about where research could be oriented to guide some deeply relevant policy questions.

The Cost of ‘Free’ – or why I don’t like freeware

This is a partial response to Fabio Rojas recent post on the fate of Stata, a statistics package, given the rise of a free alternative, R. Rojas and others have many reasons for why R is a good package, but for now I wish to deal with the argument that it being ‘free’ is a virtue.

R is free, but I see it as a fault because it reveals that it doesn’t have a devoted support system and because it isn’t free at all. It’s actually very costly!

If you’ve spent any time with an economist you should know that there is no such thing as a free lunch. If R is free we should not simply assume it is better. To the contrary we should ask why it is free. As I have tried to argue elsewhere, it is because when you purchase software you aren’t just purchasing a few lines of code. You’re purchasing the support system that comes with it. When a company purchases Stata, or any commercial software, they do so with the expectation that they can call a dedicated hotline for troubleshooting. As software has evolved you’ve seen companies experiment with pricing to acknowledge the fact that we don’t purchase a one time software but a continuous support system.

Consider Xbox or Playstation’s online services. Their use is charged on a per time basis because it costs money to run servers and provide customer support. Even ‘freemium’ games, which nominally don’t require any money to play, survive off micro transactions which enable companies to earn steady revenues in exchange for continuing support and new content. I would not be surprised if freemium statistical software is tried in the future – access to basic regressions is free but more advanced models cost money to run. I half joke.

But let’s assume you’re good at coding and don’t need much support outside of a few days reading an R book. Should you praise R for being ‘free’? No, because you still paid the time value of your time. Every hour spent learning how to code in R is an hour you could have spent doing any number of things.

Now to be clear, you may still want to learn R if it frees up your time in the future by automating X process. This post isn’t to argue against adopting R. My point is only to say that it isn’t free in a meaningful sense. Adopting R costs in the sense that you’re giving up a devoted support system and value of time equal to how long it takes you to become proficient in it.

It’s possible that once you account for those things R is still ‘cheaper’ than commercial software like Stata or SPSS. That is an empirical question beyond the scope of this post.

A Little More on “Price Gouging”

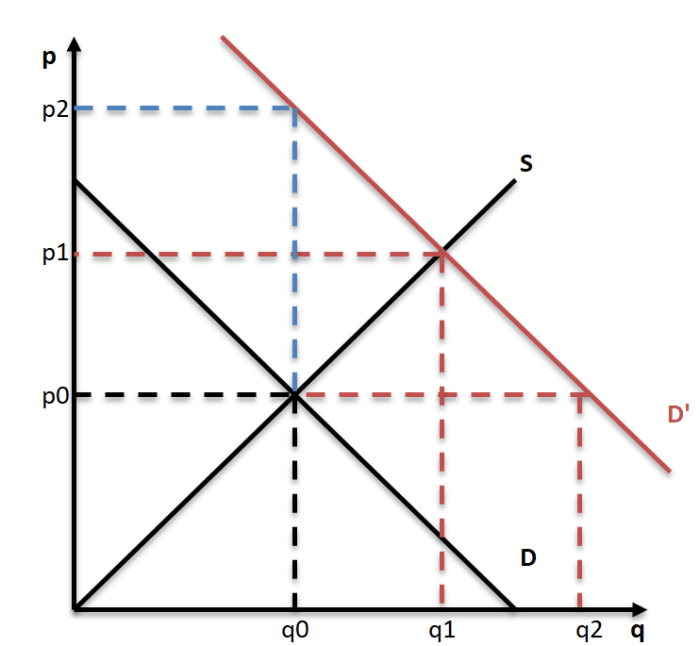
In my previous post on this subject I argued that the critics of “anti price-gouging laws” are mistakenly assuming that is possible to satisfy demand at the pre-natural disaster price. That is, sadly of course, fiction. It it not our reality anymore and we are better accepting the new situation than blindly deny it. As many economists are explaining these days, to not let prices increase after a natural disaster does more harm than letting prices increase. This can easily be seen in a demand and supply graph.

Prige gouging

Consider first just the lines in black. Those lines represent the pre natural disaster situation. What is considered “normal prices”. At price p0, a quantity q0 of a good is traded in the market (i.e. bottles of water.)

Now there is a shock. A hurricane hits this region and demand increases (shifts to the right). This is the demand line in color red. The red dotted line that extends to the right shows the size of the shortage (q2 – q1) at the “normal and fair” price.

Price gouging is an emotional loaded word, but it doesn’t have any specific economic meaning. How does “price gouging” show up in this graph? It is the increase in price from p0 to p1. This is the increase in price required to satisfy the higher demand and provide the extra number of goods (q1 – q0). No… supply is not horizontal.

What happens if price increases are banned? Then at the pre-crisis quantity (q0), consumers are willing to pay p2, a price even higher than price gouging. This means two things. First, a number of people in need will be unable to acquire the goods (the empty shelf problem). Second, that the actual total cost (to those who acquire the quantity q0) is p2, not p0. The difference between the price in the store and total cost falls into waiting in long lines, visiting a long number of stores, bribing producers (yes… with natural disaster price controls also lead to black markets), calling favors., etc. Any principles of microeconomic textbook has plenty of more examples under the price ceiling discussion.

There are three scenarios being discussed here.

  1. Quantity q0 at price p0
  2. Quantity q1 at price p1
  3. Quantity q0 at price p2

The natural disaster makes scenario 1 impossible. And it is not clear that scenario 3 is better for those in need than scenario 2. Less goods are provided at a higher total cost than in scenario 2.

One final remark. Note that in this analysis the natural disaster only affected demand. Of course, it is quite likely that supply would also be affected. The point, however, is to show that prices are not pushed up only by produces. As we can see in this case, it is consumers who are increasing the price and producers reacting to the new behavior of consumers.

The language of the economy: prices

50 Things That Made the Modern Economy is looking for a 51st thing. Below is the email I sent them.

Continue reading

Price Gouging: Reality vs Fiction

In a previous post I comment on a too common economic fallacy, that a natural disaster is good for the economy because of its alleged impact on GDP. Economic fallacies are not the only misconceptions gaining momentum during a natural disaster, but a confusion between reality and fiction becomes also quite common. The issue of price gouging provides a good example of this situation.

After a natural disaster, the price of certain goods such as water or gas, increases significantly. This is seen as an immoral exploitation by merchants who are taking advantage of the people affected by the natural disaster. Even though in this post I want to comment on another issue, it is worth mentioning that the now limited resources should be allocated to those in most need (rather than, for instance, to whoever happens to be the first one in line.) And unless someone has a crystal ball, there is no way of knowing who is in most need without changes in relative prices.

The mention to reality versus fiction refers to the fact that the critics of price gouging seem to (implicitly) assume that the natural disaster did not occur. It is plausible to assume that an event like this would (1) shift the supply to the left [reduce supply of goods] and (2) shift the demand to the right [increase the demand of goods.] At the usual (or “normal”) price these goods are in serious shortage.

This means that in the event of a natural disaster the option is between (1) having goods at a higher price or (2) not having goods at the “normal” price. This is the new reality. The old and normal reality does not exist anymore. To limit price gouging results in a lower price in the store, but not goods on the shelf. This would not help those in need. The fiction consists in thinking that a larger supply can be secured without an increase in the price (why should we assume supply is horizontal when these goods usually have a low elasticity?) An efficient policy would secure the provision of goods rather than secure a low price without the goods. Reality, rather than fiction, should be the first driver of a policy designed to assist during a natural disaster. As Milton Friedman insisted, a policy is to be valuated by its results (or design), not by its intentions.

The first rule for an efficient policy should be to not get in the way of changes in relative prices. Otherwise help will become erratic and inefficient. It might be more efficient, for instance, to make use of firms specialized in logistics (i.e. firms such as Walmart) and subsidize the demand than start a price control policy. For instance, a tax credit or a check can be sent to those affected by the natural disaster allowing them to pay the now higher prices. Similarly, a subsidy can be given to those firms bringing goods to the damaged areas (who says the government has the monopoly of charity or that the only one who can do it efficiently?) A policy on these lines would be more efficient than interfering with relative prices.

However, some opponents of price gouging seem to be more interested in damaging merchants than in making sure resources will be efficiently allocated among the ones affected by the natural disaster. Those who do not oppose price gouging do so because they have the affected ones first in line. It is not about merchant’s revenue, it is about allocating goods efficiently. Damaging the merchants should not be more important than worsening the situation of those in need.

No, natural disasters are not good for the economy.

Every time there is a natural disaster old economic fallacies make their appearance. And they are usually always the same. In particular, the argument that a natural disaster is good for the economy. This should make little sense. Wealth is not created by destroying things. A natural disaster destroys wealth, doesn’t create it. I doubt anyone affected by a hurricane would argue that he is better off after the natural disaster than before.

The argument that an event such as a natural disaster is good for the economy rests in the positive impact seen in GDP (as is argued) after the natural event. If GDP increases, then the economy is doing better. But this is a misreading of GDP. This variable is a flow of wealth, it is not a stock of accumulated wealth. It is possible that wealth creation (flow) increases at the same time the stock of wealth is decreasing. And this is what happens during a natural disaster.

Imagine that someone’s house caught fire and burns down. Because of this situation, this person decides to start working extra hours to increase his income and be able to buy a new one. The extra hours makes his income (GDP) increase. But his situation is considerable worst because he lost his stock of wealth (remember Bastiat’s broken window fallacy…?). Arguing that a natural disaster (or a war, etc…) is good for the economy is like arguing that this person is better of because he has to work extra hours to recover his loss.

This is just another case of a too common fallacy in economics. We know that if the economy is doing better the result will be better GDP and unemployment indicators. But from observing a better GDP and unemployment indicators we cannot, and should not, conclude that the economy is doing better. More important than observing what is happening to GDP is understanding why is changing its behavior.

It could be argued that one of the problem of the Keynesian view of the world is the focus on what happens to output and unemployment rather than why these variables are moving. Not surprisingly, we get to the conclusion that going to war (or having a natural disaster) would be a good way to achieve full employment.