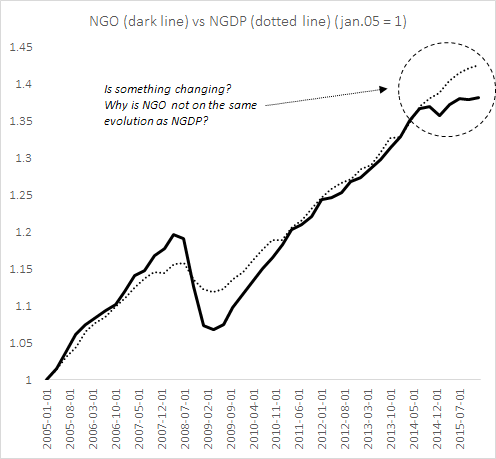
I did not think that my post on NGO versus NGDP would gather attention, but it did (so, I am happy). Nick Rowe of Carleton University and the (always relevant) blog Worthwhile Canadian Initiative responded to my post with the following post (I was very happy to see a comment by Matt Rognlie in there).
Like Mr. Rowe, I prefer to speak about trade cycles as well. I do not know how the shift from “transactions” to “output” occurred, but I do know that as semantic as some may see it, it is crucial. While a transaction is about selling a unit of output, the way we measure output does not mean that we focus on all transactions. I became aware of this when reading Leland Yeager (just after reading about the adventures on Lucas’ Islands). However, Nick (if I may use first names) expresses this a thousand times better than I did in my initial post. When there is a shift of the demand for money, this will affect all transactions, not only those on final goods. Thus, my first point: gross domestic product is not necessarily the best for monetary transaction.
In fact, as an economist who decided to spend his life doing economic history, I do not like gross domestic product for measuring living standards as well (I’ll do a post on this when I get my ideas on secular stagnation better organized). Its just the “least terrible tool”. However, is it the “least terrible” for monetary policy guidance?
My answer is “no” and thus my proposition to shift to gross output or a measure of “total spending”. Now, for the purposes of discussion, let’s see what the “ideal” statistic for “total spending” would be. To illustrate this, let’s take the case of a change in the supply of money (I would prefer using a case with the demand for money, but for blogging purposes, its easier to go with supply)
Now unless there is a helicopter drop*, changes in the money supply generate changes in relative prices and thus the pattern (and level) of production changes too. Where this occurs depends on the entry point of the increased stock of money. The entry point could be in sectors producing intermediary goods or it could closer to the final point of sale. The closer it is to the point of sale, the better NGDP becomes as a measure of total spending. The further it is, the more NGDP wavers in its efficiency at any given time. This is because, in the long-run, NGDP should follow the same trend at any measure of total spending but it would not do so in the very short-run. If monetary policy (or sometimes regulatory changes affecting bank behavior “cough Dodd-Frank cough”) causes an increase in the production of intermediary goods, the movements the perfect measure of total spending would be temporarily divorced from the movements of NGDP. As a result, we need something that captures all transaction. And in a way, we do have such a statistic: input-output tables. Developed by the vastly underrated (and still misunderstood in my opinion) Wassily Leontief, input-output tables are the basis of any measurement of national income you will see out there. Basically, they are matrixes of all “trades” (inputs and outputs) between industries. What this means is that input-output tables are tables of all transactions. That would be the ideal measure of total spending. Sadly, these tables are not produced regularly (in Canada, I believe there are produced every five years). Their utility would be amazing: not only would we capture all spending (which is the goal of a NGDP target), but we could capture the transmission mechanism of monetary policy and see how certain monetary decisions could be affecting relative prices.** If input-output tables could be produced on a quarterly-basis, it would be the amazing (but mind-bogglingly complex for statistical agencies).
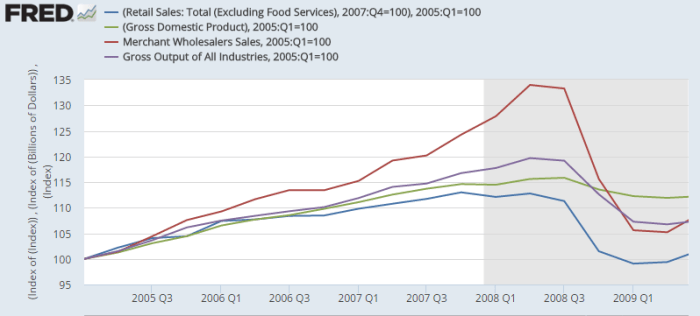
The closest thing, at present, to this ideal measure is gross output. It is the only quarterly statistic of gross output (one way to calculate total spending) that exists out there. The closest things are annual datasets. Yet, even gross output is incomplete as a measure of total spending. It does not include wholesale distributors (well, only a part of their activities through value-added). This post from the Cobden Centre in England details an example of this. Mark Skousen in the Journal of Private Enterprise published a piece detailing other statistics that could serve as proxies for “total spending”. One of those is Gross Domestic Expenditures and it is the closest thing to the ideal we would get. Basically, he adds wholesale and retail sales together. He also looks at business receipts from the IRS to see if it conforms (the intuition being that all sales should imitate receipts claimed by businesses). His measure of domestic expenditure is somewhat incomplete for my eyes and further research would be needed. But there is something to be said for Skousen’s point: total nominal spending did drop massively during the recession (see the fall of wholesale, gross output and retail) while NGDP barely moved while, before the recession, total nominal spending did increase much faster than NGDP.
In all cases, I think that it is fair to divide my claim into three parts: a) business cycles are about the deviation from trends in total volume of trades/transactions, thus the core variable of interest is nominal expenditures b) NGDP is not a measure of total nominal spending whose targeting the market monetarist crowd aims to follow; c) since we care about total nominal spending, what we should have is an IO table … every month and d) the imperfect statistics for total spending show that the case made that central banks fueled spending above trend and then failed to compensate in 2008-2009 seems plausible.
Overall, I think that the case for A, B and C are strong, but D is weak…
* I dislike the helicopter drop analogy. Money is never introduced in an equal fashion leading to a uniform price increase. It is always introduced through a certain number of entry points which distort relative prices and then the pattern of trade (which is why there is a positive short-term relation between real output and money supply). The helicopter drop analogy is only useful for explaining the nominal/real dichotomy for introductory macro classes.
** Funny observation here: if I am correct, this means that Hayek’s comments about the structure of production would have been answered by using Leontief’s input-output table. Indeed, the Austrians and Neoclassicals of the RBC school after them have long held that monetary policy’s real effects are seen through changes in the structure of production (in the Austrian jargon) or by inciting more long-term projects to be undertaken creating the “time to build” problem (in the RBC jargon). Regardless of which one you end up believing (I confess to a mixed bag of RBC/Austrian views with a slight penchant to walk towards Rochester), both can be answered by using input-output tables. The irony is that Hayek actually debated “planning” in the 1970s and castigated Leontief for his planning views. Although I am partial (totally) to Hayek’s view on planning, it is funny that the best tool (in my opinion) in support of Hayek is produced by an intellectual adversary