Wats On My Mind: the state of the economy

I wrote the following update for my Principles of Macroeconomics students and thought it might just count as an update for Wats On My Mind.

In the first two minutes of class, I asked you how you would know how the economy is doing. Let’s focus on our three big areas: GDP, unemployment, and inflation.

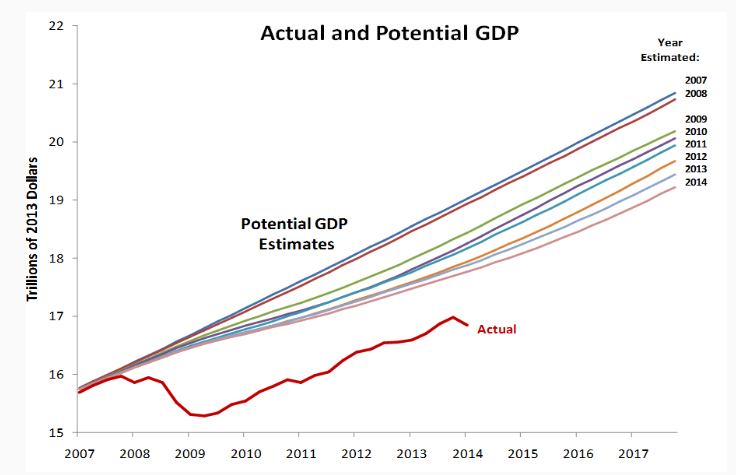
Initial estimates are that GDP decreased by 4.8% in the first quarter (Jan-Mar). Let me comment on that a bit:

  1. That number is almost certainly inaccurate. It will be revised 3 months from now, 6 months from now, and be finalized 9 months from now. That is totally normal – as more and more data rolls in, our estimates get better. My bet is that the number is worse than that because closed firms won’t be reporting anything yet.
  2. The number for the second quarter will certainly be worse than that. We were only closed for 2-3 weeks in March, so the fact that we’re done that much in such a short window is a bad sign. We have already been closed longer in this quarter and the careful, measured opening we’re doing right now – which I think is wise to prevent a new spike of cases – won’t make for an instantaneous rebound.
  3. This is as bad as we saw during the Great Recession, but faster. Again, my hope and expectation is that our recovery will also be faster.
  4. GDP dropped in the EU by 14%. So it could be a lot worse!

The Bureau of Labor Statistics also released new numbers. So far 30 million Americans have filed for unemployment. That is roughly 18-19% of the workforce. This is officially, as expected, the highest unemployment rate since the Great Depression in the 1930s. The good news is that the number of new applicants has been going down each week, from 6.8 million at the end of March to “only” 3.8 million last week. (Recall: That’s still 4x larger than the previous high set in the 1980s.) The other bit of good news is that 90% of unemployed workers expect to return to their old job, while that number is usually only 40%. That gives me more encouragement that we could quickly bounce back.

Inflation is DOWN. If this were primarily a supply shock, we would be seeing overall higher prices. That means the drop in aggregate demand is bigger than the supply shock. To a Keynesian or a Monetarist, that also means that all the fiscal and monetary stimulus we have done so far is not enough and more needs to be done. To a Classical economist, the thing that needs to be fixed is still supply – demand itself is not terribly important. A Hayekian, of course, thinks all this stimulus is making things worse – it messes with the price signals markets rely on.

To get a rough estimate of where inflation is going, I have been recommending comparing TIPS bonds to nominal bonds because the difference between the interest rate on those bonds (the TIPS spread) is the market’s best guess of inflation. As you can see here the TIPS spread fell from 1.8% in 2019 to 0.5% at the end of March. During April, it has recovered slightly to 1-1.2%. A very rough guesstimate based on that suggests we would need a stimulus 3x as large as we have done right now to return inflation expectations to normal. !!!

The very idea of having Congress spend an extra $5 trillion on top of what is already being done is more than my little fiscally-conservative heart can comprehend just now. Politically, though, I expect Congress will find it in their hearts/re-election campaigns to have another round of stimulus. The Federal Reserve has even called on Congress to spend more, so have no fears of monetary offset hampering anything. Here is a monetarist arguing the Fed needs to do a great deal more to ensure spending expectations don’t fall. One of the points, though, is that we should not expect hyperinflation is around the corner.

On that first day, most students suggested looking at the stock market. From Feb 21-Mar 23 the Dow lost 10,000 points – 1/3 of its value. Since then it has recovered more than half. Notice that the drop came BEFORE quarantine and that the stock market has been recovering even as unemployment has climbed to record heights. This is another reason I don’t recommend imagining that the stock market gives a clear and unbiased view of what’s going on in “the economy”! The situation right now is clearly much worse than it was a month ago, so trying to figure out current conditions would not make sense. If I wanted to give it the best spin possible, I’d say the stock market is predicting better times ahead despite how bad things currently are.

 A few other data points:

  • 59% of Americans say they can social distance as long as needed, which is up from a few weeks ago. (Gallup)
  • Western European countries started reopening earlier than we have and they are starting to see an increase in cases and deaths again. Now, so far that’s only a 3-day trend and it could just be a blip, but it’s not encouraging.
  • Most people are actually behaving like decent, responsible people during the crisis – and they usually do.

Crisis, governments and the micro-macro conundrum

Layoffs and salary cuts are individual firm responses to a crisis that may make sense from a micro perspective- it is about saving money – but they will have dire consequences on the macro level.

I lived through this in Greece. Ten years ago, every firm was expecting the worst to come from the memorandum. They started making people redundant, pulling out from planned investment and cutting salaries. Unemployment went up, demand collapsed, public revenue went down, more austerity measures were needed and the downward spiral deepened. The country ended up losing one third of its economy in just four years.

Will it now be Greece on steroids everywhere?

The side effects of myriads of micro adaptations appear on the macro level. This is a key problem for economics and is particularly challenging for Austrian economics. Entrepreneurs creatively respond to a crisis by adopting a cautious and defensive approach long before some of them could spot new opportunities for investment and take positive action to exploit them. But if they all choose to first play ‘defense’, they shape the macro-environment in patterns that keeps telling most of them “keep on protecting yourself”, “there are more risks than opportunities out there”. Both supply and demand are on a continuous downward spiral. While some discerning entrepreneurs will spot some opportunities even in the direst of the circumstances, their plans need time to materialise and some may never come to fruition. In the meantime, most economic actors are not well positioned to start what they know to do well, and many have already lost their money in activities that went downhill.

On the other hand, the side effects of a large top down intervention such as the global lock down confirms the Austrian critique that central planning is also a risky endeavour. In an effort to control a complex reality, radical top-down interventions can divert investment to the specific activities they prop up, which appear sustainable for as long as this diversion lasts. Restrictive measures can also backfire, such as Greece’s shock austerity that was intended to balance the budget in Greece, or can prolong a precarious environment, such as the debt-fuelled bailouts elsewhere to save the banking system.

The problem is that policymakers do not have the tools to gain a full grasp of any potential unintended or undesired consequences from their actions. When they focus on one range of analysis, such as preventing a spike of deaths during the epidemic, the measures they take can generate a cascade of negative side effects in areas off their alarmed radar which they may have no idea how to arrest or fix.

I don’t see this micro-macro antithesis as an automatic validation of post Keynesianism in the sense that capitalism is always inherently unstable. It is unstable in periods of crisis when the micro and the macro can become a contradiction.

Exogenous shocks periodically happen. But it is worth studying what post Keynesians state: a crisis can emerge endogenously as in the financial markets.

The way out may be to think in terms of resilience rather than stability. I am inspired by Hilton Root’s forthcoming book Network Origins of the Global Economy. Resilience is the capacity of a system to accommodate turbulences and absorb shocks in recurrent episodes of instability. The system is unstable but can withstand the stresses.

Are multiple adjustments by adaptive agents able to bring about resilience in a system? Or do we need a central node to gain control and bring about order? Is a centrally-induced order a structure of relations that can be resilient over time, given that it depends on the health of the central node and knowing that the capacity of governments to understand and predict is limited?

Nightcap

  1. The future of cooperation in Antarctica Klaus Dodds, History Today
  2. Samantha Power’s new memoir is out Arnold Isaacs, War on the Rocks
  3. What do we actually know about the economy? Paul Krugman, New York Times
  4. The rabble and the rich (luxury beliefs) Rob Henderson, Quillette

Nightcap

  1. The curse of size Scott Sumner, EconLog
  2. Does size matter? Edwin van de Haar, NOL
  3. The towering statesmanship of George Washington Matthew Franck, Law & Liberty
  4. The Washington Doctrine of Unstable Alliances RealClearHistory

Not all GDP measurement errors are greater than zero!

Bryan Caplan is an optimist. He thinks that economists do many errors in estimating GDP (overall well-being). He is right in the sense that we are missing many dimensions of welfare improvements in the last half-century (see here, here and here). These errors in measurements lead us to hold incorrectly pessimistic views (such as those of Robert Gordon). However, Prof. Caplan seems to argue (I may be wrong) that all measurements problems and errors are greater than zero. In other words, they all cut in favor of omitting things. There are no reasons to believe this. Many measurement problems with GDP  data cut the other way – in favor of adding too much (so that the true figures are lower than the reported ones).

Here are two errors of importance (which are in no way exhaustive): household output and adjustments for household size.

Household Output

From the 1910s to the 1940s, married women began to enter moderately the workforce. This trickle became a deluge thereafter. National GDP statistics are really good at capturing the extra output they were hired to produce. However, national GDP statistics cannot net out the production that was foregone: household output.

A married woman in 1940 did produce something: child-rearing, house chores, cooking, allowing the husband to specialize in his work. That output had a value. Once offered the chance to work, married women thought the utility generated from producing “home outputs” was inferior to the utility generated from “market work”. However, the output that is measured is only related to market work. Women entered the labor force and everything they produced was considered a net addition to GDP. In reality, any economist worth his salt is aware that the true improvement in well-being is equal to the increased market output minus the forsaken house output. Thus, in a transition from a “male-labor force” to a “mixed labor force”, you are bound to overestimate output increases.

How big of an issue is this? Well, consider this paper from 1996 in Feminist Economics. In that paper, Barnet Wagman and Nancy Folbre calculate output in both the “household” and “market” sectors. They find that even very small changes in the relative size of these sectors alter growth rates by substantial margins. Another example, which I discussed in this blog post based on articles in the Review of Income and Wealth, is that when you make the adjustment over four decades of available Canadian data, you can find that one quarter of the increase in living standards is eliminated by the proper netting out of the value of non-market output. These are sizable measurement errors that cut in the opposite direction as the one hypothesized by prof. Caplan (and in favor of people like prof. Gordon).

Household Size

Changes in household sizes also create overestimation problems. Larger households have more economies of scale to exploit than smaller households so that an income of $10,000 per capita in a household of six members is superior in purchasing power than an income of $10,000 per capita in a single-person household. If, over time, you move from large households to small households, you will overestimate economic growth. In an article in the Scottish Journal of Political Economy, I showed that making adjustments for household sizes over time yields important changes in growth rates between 1890 and 2000. Notice, in the table below, that GDP per adult equivalent (i.e. GDP per capita adjusted for household size) is massively different than GDP per capita. Indeed, the adjusted growth rates are reduced by close to two-fifths of their original values over the 1945-2000 period and by a third over the 1890 to 2000 period. This is a massive overestimation of actual improvements in well-being.

HouseholdAdjust

A large overestimation

If you assemble these two factors together, I hazard a guess that growth rates would be roughly halved (there is some overlap between the two so that we cannot simply sum them up as errors to correct for – hence my “guess”). This is not negligible. True, there are things that we are not counting as Prof. Caplan notes. We ought to find a way to account for them. However, if they simply wash out the overestimation, the sum of errors may equal zero. If so, those who are pessimistic about the future (and recent past) of economic growth have a pretty sound case. Thus, I find myself unable to share Prof. Caplan’s optimism.

NGO v. NGDP: In reply to Nunes and Sumner

A week ago, I initiated a discussion on using another indicator of nominal spending instead of NGDP when the time comes to set monetary policy. My claim was that NGDP includes only final goods and as a result, it misses numerous business-to-business transactions. This means that NGDP would not be the best indicator. I propose a shift to a measure that would capture some intermediate transactions.

The result was a response by Nick Rowe (to which I did respond), Matt Rognlie, Marcus Nunes and Scott Sumner (to whom I am responding now). Nunes and Sumner are particularly skeptical of my claim. I am providing a first response here (and I am attempting to expand it for a working paper).

The case against NGDP

GDP has important shortcomings. First of all, thanks to the work of Prescott and McGrattan (2012 : 115-154), we know that a sizable part of capital goods acquisition fails to be included inside GDP. That sizable part is “intangible capital” which Prescott and McGrattan define as the “accumulated know-how from investing in research and development, brands, and organizations which is the most part expensed rather than capitalized” (p.116).  Yet, investments in research and development are – in pure theoretical terms – like the acquisition of capital goods. However, national accounts exclude those. Once they’re included in papers like those of Prescott and McGrattan and those of Corrado, Hulten and Sichel (2009), increases in productivity were faster prior to 2008 and that the collapse after 2008 was much more pronounced.  In addition, this form of capital is increasing much faster than tangible so that its share of the total capital stock increases. Thus, the error of not capturing this form of capital good investment is actually growing over time causing us to miss both the level and the trend.

A second shortcoming of importance is the role of time in production. Now, just the utterance of these words makes me sound like an Austrian. Yet, this point is very neoclassical since it relies on the time to build approach. In the time-to-build model of the real business cycle approach, production occurs over many periods. Thus changes in monetary policy may have some persistence.  The time-to-build model proposes that firms undertake long projects and consume more inputs. In terms of overall transactions, this will mean more and more business to business (B2B) transactions.  Hence if an easy monetary policy is inciting individuals to expand their number of projects that have more distant maturities, then a focus on GDP won’t capture the distortionary effects of that policy through. Similarly, if monetary policy tightens (either directly as a fall of the money supply or through an uncompensated change in velocity), the drop in economic activity as projects are closed down will not equally well captured. While this point was initially advanced by Kyland and Prescott (1982), some Austrians economists have taken up the issue (Montgomery 1995a; 1995b; 2006; Wainhouse 1984; Mulligan 2010), several neoclassicals have also taken it up (Kühn 2007; Kalouptsidi 2014; Kyland, Rupert, Sustek, 2014).

Why shift to another measure

My contention is that NGO (Nominal Gross Output) allows us to solve a part of that problem. First of all, NGO is more likely to capture a large share of the intangible capital part since, as a statistic, it does not concern itself with double counting. Hence, most of the intangible capital expenses are captured. Secondly, it also captures the time-to-build problem by virtue of capturing inputs being reallocated to the production of projects with longer maturities.

Thus, NGO is a better option because it it tries to capture the structure of production. The intangible capital problem and the time to build problem are both problems of intermediate goods. By capturing those, we get a better approximate idea of the demand for money.

Let me argue my case based on the Yeager-esque assumption that any monetary disequilibrium is a discrepancy between actual and desired money holdings at a given price level. Let me also state the importance of the Cantillon effects whereby the point of entry of money is important.

If an injection of money is made through a given sector that leads him to expand his output, the reliability of NGDP will be best if the entry-point predominantly affects final goods industry. If it enters through a sector which desires to spend more on intangible investments or undertake long-term projects, then the effects of that change will not appear as they will merely go unmeasured. They will nonetheless exist. Eventually firms will realize that they took credit for these projects for which the increased output did not meet any demand. The result is that they have to contract their output by a sizable margin. In that case, they will abandon those activities (imagine unfinished skyscrapers or jettisoned research projects).

In such situations, GO (or even a wider measure of gross domestic expenditures) are superior to GDP. And in cases where the effects would start in final-goods industry, then they have the same efficiency as GO (or the wider measure of gross domestic expenditures.

The empirical case

The recurring criticism in most posts is that NGO is volatile over the period when the data is available (2005Q1-today). True, the average growth rate of NGO is the same as NGDP over the same period, but the standard deviation is nearly twice that of NGDP. However if you exclude the initial shock of the recession, the standard deviations converge. In a way, all the difference in volatility between the two series is driven by the shock of the recession. Another way to see it is to recompute two graphs. One is an imitation of the graphs by Nunes where NGDP growth in period T is compared with growth in the period T minus 1, but we add NGO. The second is the ratio of NGO to NGDP.

As one can see from the first figure, NGO and NGDP show the same relation except for a cluster of points at the bottom for NGO. All of those lower points are related to the drop from the initial recession. All concentrated at the bottom. This suggests that the recession had a much deeper effect than otherwise believed. The second graph allows us to see it.

Nunes

The ratio of NGO to NGDP shows that the two evolved roughly the same way over the period before the recession. However, when the recession hit, the drop was more important and the ratio never recovered!  This suggest a much deeper deviation from the long-term trend of nominal spending which is not seen at the final level but would be seen rather in the undertaking of long-term projects and the formation of intangible capital (the areas that NGDP cannot easily capture).

Ratio.png

The case for NGO over NGDP is solid. It does not alter the validity of the case for nominal spending stability. However since the case for nominal spending stability hinges on total transactions of inputs and outputs more than it does on the final goods sold, NGO is a better option.


Quick comment in response to Rognlie 
In his reply to Nick Rowe, Matt Rognlie states that the more important fall of NGO is explained by changes in relative prices. Although his transformation shows this, the BEA disagrees. Here is the explanation provided by the BEA:
For example, value added for durable-goods manufacturing dropped 15 percent in 2009, while gross output dropped 19 percent.  The decline in gross output is much more pronounced than the decline in value added because it includes each of the successive declines in the intermediate inputs supply chain required to manufacture the durable goods.


Was Murphy Foolish to Take Caplan’s Bet?

A few days ago, Bryan Caplan posted on his bet with Robert Murphy regarding inflation. Murphy predicted 10% inflation. He lost … big time. However, was he crazy to make that bet?  In other words, what could explain Caplan’s victory?

Murphy was not alone in predicting this, I distinctly remember a podcast between Russ Roberts and Joshua Angrist on this where Roberts tells Angrist he expected high inflation back in 2008. Their claims were not indefensible. Central banks were engaging in quantitative easing and there was an important increase of the state money supply. There was a case to be made that inflation could surge.

It did not. Why?

In a tweet, Caplan tells me that monetary transmission channels are much more complex than they used to be and that the TIPS market knew this. Although I agree with both these points, it does not really explain why it did not materialize. I am going to propose two possibilities of which I am not fully convinced myself but whose possibility I cannot dismiss out of hand.

Imagine an AS-AD graph. If Murphy had been right, we should have seen aggregate demand stimulated to a point well above that of long-run equilibrium. Yet, its hard to see how quantitative easing did not somehow stimulate aggregate demand.  Now, if aggregate demand was falling and that quantitative easing merely prevented it from falling, this is what would prove Murphy wrong. However, all of this assumes no movement of supply curves.

While AD falls and before monetary policy kicks in, imagine that policies are adopted that reduce the potential for growth and productivity improvement. In a way, this would be the argument brought forward by people like Casey Mulligan in work on labor supply and the “redistribution recession” and Edward Prescott and Ellen McGrattan who argue that, once you account for intangible capital, the real business cycle model is still in play (there was a TFP shock somehow). This case would mean that as AD fell, AS fell with it. I would find it hard to imagine that AS shifted left faster than AD. However, a relatively smaller fall of AS would lead to a strong recession without much deflation (which is what we have seen in this recession). Personally, I think there is some evidence for that. After all, we keep reducing the estimate for potential GDP everywhere while the policy uncertainty index proposed by Baker, Bloom and Davids shows a level change around 2008.  Furthermore, there has been a wave – in my opinion of very harmful regulations – which would have created a maze of administrative costs to deal with (and whose burden is heavy according to Dawson and Seater in the Journal of Economic Growth). That could be one possibility that would explain why Murphy lost.

download

There is a second possibility worth considering (and one which I find more appealing): the role of financial regulations. Now, I may have been trained mostly by Real Business Cycle guys, but I do have a strong monetarist bent. I have always been convinced by the arguments of Steve Hanke and Tim Congdon (I especially link Congdon) and others that what you should care about is not M1 or M2, but “broad money”. As Hanke keeps pointing out, only a share of everything that we could qualify broadly as “money” is actually “state money”. The rest is “private money”. If a wave of financial regulations discourages banks to lend or incite them to keep greater reserves, this would be the equivalent of a drop of the money multiplier. If those regulations are enacted at the same time as monetary authorities are trying to offset a fall in aggregate demand, then the result depends on the relative impact of the regulations. The data for “broad money” (Hanke defines it as M4) shows convincingly that this is a potent contender. In that case, Murphy’s only error would have been to assume that the Federal Reserve’s policy took place with everything else being equal (which was not the case since everything seemed to be moving in confusing directions).

globr-asia-nov-2014-1bg

In the end, I think all of these explanations have value (a real shock, a banking regulation shock, an aggregate demand shock). In 25 years when economic historians such as myself will study the “Great Recession”, they will be forced to do like they do with Great Depression: tell a multifaceted story of intermingled causes and counter-effects for which no single statistical test can be designed. When cases like these emerge, it’s hard to tell what is happening and those who are willing to bet are daredevils.

P.S. I have seen the blog posts by Scott Sumner and Marcus Nunes regarding my NGO /NGDP claims. They make very valid points and I want to take decent time to address them, especially since I am using the blogging conversation as a tool to shape a working paper.

Around the Web

  1. Superior Mayan Engineering.
  2. Gary North: The Libertarian Taliban.
  3. How Much Does the Market Organization of Economic Life Matter?
  4. Margaret Thatcher’s Triumph.
  5. The Republic of Baseball.