The Chetty et al. paper is probably one of the most important papers of 2016 and it will long be debated. Many comments have been made on this and I need to reiterate that I do not believe the trend to be off, merely the level. I have just found another reason to doubt the level by thinking about demography. It relates to one key methodological decision made in the paper: taking the income of parents in the 25 to 35 years old age-window. This is a fixed window where their incomes are compared to that of a child at age 30.
This is probably a flaw that alters the level evolution importantly. My argument is simple. A person born in 1940 was, by the time he was 30, close to his peak earning point. A person born in 1980, by the time he is 30, is further away from a higher peak earning point. Thus, you are not comparing the same type of birth cohorts. In simpler terms, I am saying that with the 1940 birth cohort you are comparing children who, by age 30, were at the apex of their earnings while those of the 1980 birth cohort were not at the apex.
From the work of Ransom and Sutch on the economic history of aging in the United States, I remembered that graph (for late 19th century Michigan). What I see is that for most workers, by 30 years of age, they are pretty much at the top of their earnings cure. Over time, if the shape of the curve does not change and simply keeps moving upwards, then there are no problems with the level of absolute mobility measured by Chetty et al.
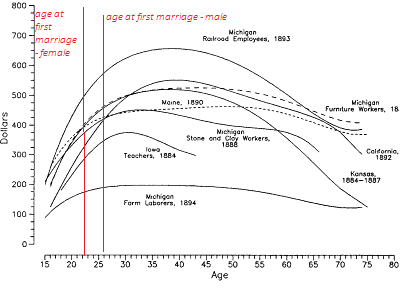
But here is the problem, the curve does change shape! There are no longer flat lines like that of the Michigan farm laborers in the figure above. Earnings curve look more and more like that of the Michigan railroad employees. Not only that, the peak point is now higher in terms of income and at a further point in time. And that makes sense since we are studying longer and working menial jobs while we do for which we earn low incomes. When we enter the labor force, we get a very steep rise at a later point in our lives than our fathers or mothers did. So the earning curve of younger cohorts is more skewed than that of earlier cohorts. Kitov and Kitov shows the evolution of income by age groups relative to a fixed groups and as one can see, the youngest are getting further away from the peak over time – implying that it is shifting. Again, from Kitov and Kitov, you can see that the 2013 curve starts later and has a steeper curve than the 1967 curve. From this trend in the earnings curve, we can more or less be certain that by 30, a person born in 1940 was closer to peak earnings than a person born in 1980. Thus, the person born in 1940 is at his apex (by the time he turns 30) when compared to his parents and the person born in 1980 is not at his apex when compared to his parents. (I am only using Kitov and Kitov for the sake of showing the evolution but this metamorphosis of the curve, I think, is not in dispute).
So, by setting the boundaries for measuring absolute mobility at a fixed point, Chetty et al. are capturing some changes that are purely related to changing demographics of the labor market and not absolute mobility. The 1940 level of mobility is too high relative to that of 1980. Chetty et al. do try to address this by looking at different time windows (they just don’t have a “rolling age window” which would be ideal – like indexing to the median age of the population).
I do accept that mobility has fallen since 1940, but I am very skeptical about how robust the big drop shown actually is. The issues of changes in family size, price deflators, taxes and transfers made me willing to entertain a fall of 25-30 points (rather than 40-45), now with this issue of the metamorphosis of the earning curves in mind, I am inching towards 20-25 points drop (still substantial).
Note: Still a big fan of Chetty et al. and their works is crucial, that’s why I don’t want pundits to try and extract this beyond what it actually says and does not say.
