I had a pre-programmed blog post on the issue of the minimum wage and poverty which was preempted by Mark Koyama (a blogger here at Notes on Liberty). The tweet is below and it has forced me to adjust the post.
An important & often neglected point. Minimum wage is s bad anti-poverty tool even if employment effects are zero https://t.co/lVEqwEhglz
— Mark Koyama (@MarkKoyama) 3 janvier 2017
Mark is absolutely right! Let me explain why with my own spin on it.
First of all, the demand curve slopes downwards – always. However, the method of adjusting to price changes (wages are a price and the minimum wage is a price control) is not an empirical constant. I am unlikely to fire workers for a 1% in the inflation-adjusted minimum wage. Firing workers implies transaction costs that are dependent of context (for example, if I am friend with my employee, this is a transaction cost in the form of a lost friendship), firm size (I won’t fire my only employee which represents 50% of my output for a 1% hike in MW) laws (firing and hiring regulations), institutions (social institutions, reputation, norms), my clientele (how elastic is their demand) and technological alternatives. For a 1% increase, I am likely to reduce work hours or cut marginal benefits (no free soup for you). For a 10% increase, I am more likely to consider the option of firing a worker or I may shift to a new technological set that reduces my demand for labor. It may happen rapidly or take some time, but there will eventually be an adjustment.
In any case, the minimum wage will imply some losses with a deadweight loss. Only the method by which it materializes is debatable. By definition, some people will be hurt and generally and even if supply is super-elastic (doubtful), some suppliers (workers) will be ejected from the market (or the quantity of labor they can supply will be ulitmately reduced). Since the minimum wage generally tends to fall on unskilled workers, this must be correlated with workers close to the poverty line.
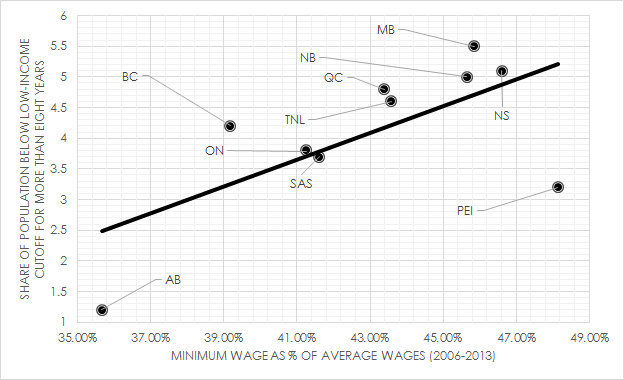
Ideally, we’d need a measure of the minimum wage to be compared with the “at-risk” population over a long period of time in order to encapsulate all the effects of the minimum wage. The perfect measure is the “length of poverty spell” variable which has been emerging progressively from the BLS. The problem is that it is not broken down by state. Fortunately, Canada has that variable (well, a low-income variable which is a relatie poverty measure) for provinces. Inside the Survey of Labor and Income Dynamics (affectionally known as the SLID), this longitudinal variable has a span of eight years. Basically, we can know if a person has been below the low-income threshold for up to eight years. Let’s take that extreme measure and plot it against the minimum wage divided by the average wage.
As one can see from the scatter plot below, there is a more or less clear relationship between the minimum wage as a share of the average wage and the length of poverty spells. What is more impressive is that this graph is not a regression. More precisely, the provinces with the highest minimum wages (like my own province of Quebec and the province of Nova Scotia) also have the most extensive social welfare nets. Alberta, a province with the lowest minimum wage ratio and one of the least “generous” social welfare net in Canada, is at the very bottom of the pack in terms of the persistence of poverty.
I think this graph acts in very modest (but clear) support to Mark’s point (which is also the point of Burkhauser, Sabia, MaCurdy and many others)

[…] https://notesonliberty.com/2017/01/03/minimum-wage-and-length-of-poverty-spells/ […]
Reblogged this on John Barleycorn and commented:
Makes sense to me.