Over the years, I became increasingly skeptical of using tax data to measure inequality. I do not believe that there is no value in computing inequality with those sources (especially after the 1960s, the quality is much better in the case of the US). I simply believe that there is a great need for prudence in not overstretching the results. This is not the first time I make this point (see my paper with Phil Schlosser and John Moore here) and I think it is especially crucial for anything prior to 1943 (the introduction of tax withholding).
One of my main point is that the work of Gene Smiley which ended up published in the Journal of Economic History has generally been ignored. Smiley had highlighted many failings in the way the tax data was computed for measuring inequality. His most important point was that tax avoidance foiled the measurements of top incomes and how well they could transposed on the overall national accounts.
More precisely, Smiley argued that the tax shelters of the 1920s and 1930s would have affected reporting behavior. As long as corporations could issue stock dividends rather than cash dividends, delaying the payment of dividends until shareholders were in lower tax brackets, there would be avoidance. Furthermore, state and municipal securities were exempted from taxation which meant that taxpayers could shelter income and end up in lower brackets. All this combined to wide fluctuations in marginal tax rates conspires to reduce the quality of the tax data in computing inequality. Rather than substantial increases in inequality, Smiley found that his corrected estimates (which kept tax rates constant) suggested no increase in inequality during the 1920s and a minimal decrease when you exclude capital gains.
Alongside John Moore, Phil Schlosser and Phil Magness, I am in the process of attempting to extend the Smiley corrections to include everything up to 1941 (Smiley had ended in 1929). As a result, I had to assemble the tax data and the tax rates and I was surprised to see that, even without regressions, we can see the problem of relying on the tax data for the interwar period.
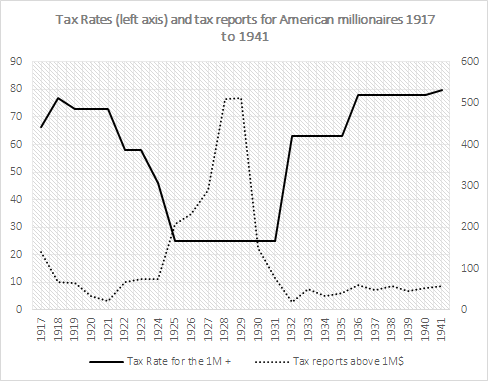
The number of millionaires in the tax reports is displayed below. As one can see, it is very low from 1917 to 1924 – a period of high tax rates. However, as tax rates fell in the 1920s, the number of millionaires quintupled. And then, when the Depression started in synchronicity with the increases in top marginal tax rates, it went back down. It went down by 89% from 1929 to 1941. Now, I am quite willing to entertain that many millionaires were wiped out during the Great Depression. I am not willing to entertain the idea that 9 out of every 10 millionaires disappeared. What I am willing to entertain is that the tax data is clearly and heavily problematic for the pre-withholding era.* This is evidence in favor of caution and prudence in interpreting inequality measures derived from tax data.
* I am of those who believe that inequality was lower than reported elsewhere in the 1920s, higher than reported in the 1930s and 1940s. Combined together, these would mean that inequality would tend to follow a L-curve or a J-curve from the 1920s up to the present rather than the U-curve often reported. I will post more on this as my paper with Moore, Schlosser and Magness progresses.

Reblogged this on John Barleycorn and commented:
Interesting
500 tax reports by millionaires drops to a little under 100 before tax rates change. Yes, tax rates affect how people report their income, but if your theory is that tax rates were the main culprit (or even a large contributor) you’re going to have to do a little more leg work to show it.